




Introduction
Organizations invest significantly in modernizing software delivery, infrastructure automation, and reliability engineering. Yet, engineering leaders often struggle to answer a fundamental question: Do our engineering improvements actually drive business success? Many teams collect vast amounts of telemetry data, tracking every deployment, pipeline run, and server restart. However, high technical productivity does not automatically guarantee revenue growth or customer satisfaction.
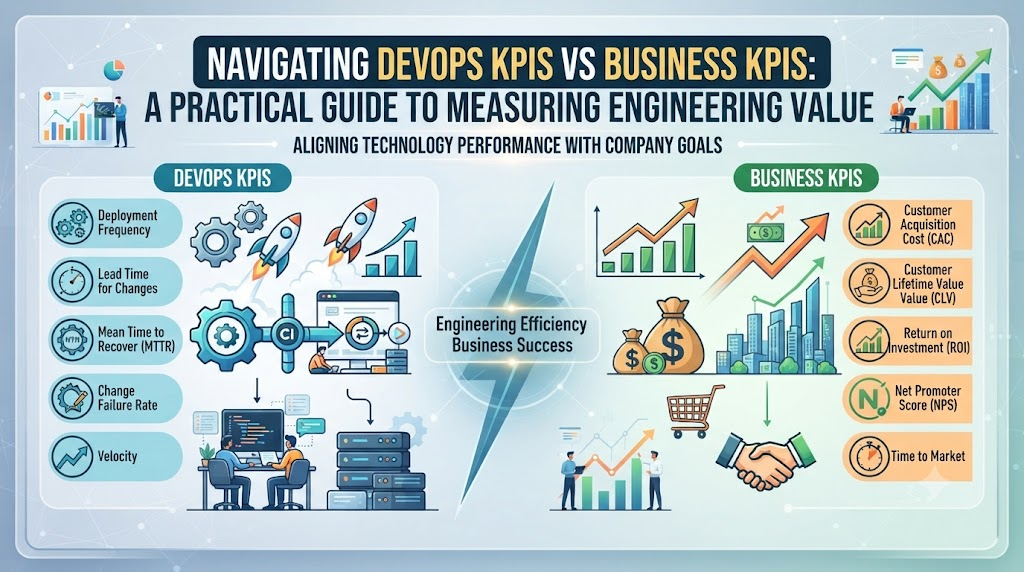
This disconnect highlights the gap between technical Key Performance Indicators and business Key Performance Indicators. DevOps KPIs measure how efficiently software moves through the delivery pipeline and how reliably systems operate. Business KPIs measure organizational performance, including revenue, customer retention, cost efficiency, and time-to-market. Bridging these two worlds allows engineering teams to connect daily technical work with tangible outcomes. When technical measurements align with strategic goals, organizations can optimize resource allocation, reduce risk, and improve user experiences.
Building this connection requires understanding both technical metrics and their downstream effects on organizational value. Effective measurement frameworks help organizations avoid optimizing internal processes that offer little external value. To learn more about structured measurement frameworks, training, and professional enablement, visit DevOpsSchool. Let us explore how to balance technical execution with business strategy.
What Are DevOps KPIs?
DevOps Key Performance Indicators are quantifiable metrics used by engineering teams to evaluate the speed, stability, security, and overall efficiency of software delivery and infrastructure operations. The primary purpose of technical measurement is to provide objective feedback on engineering performance. These metrics help practitioners identify bottlenecks in the deployment pipeline, pinpoint operational instability, and evaluate the effectiveness of automation efforts.
Delivery efficiency is a core focus of DevOps KPIs. Teams measure how quickly code moves from an initial commit to production environments. This includes evaluating the frequency of releases and the total duration required for a change to become available to users. Fast delivery allows organizations to experiment, iterate, and respond to market feedback rapidly.
Reliability and operational performance are equally critical components of technical measurement. DevOps KPIs track how often systems experience disruptions, how quickly teams detect failures, and how fast services recover. Security metrics also play a vital role, measuring vulnerability remediation times and compliance posture across infrastructure components. Common examples of DevOps KPIs include deployment frequency, lead time for changes, change failure rate, mean time to recovery, system availability, and incident volume.
What Are Business KPIs?
Business Key Performance Indicators are strategic measurements used by leadership to evaluate an organization’s overall financial health, operational efficiency, and market position. These metrics reflect how effectively a company achieves its commercial objectives and delivers value to its customers. Business KPIs focus heavily on outcomes rather than internal operational activities.
Performance measurement at the business level typically centers on customer outcomes, revenue generation, and cost efficiency. Organizations track customer retention, net promoter scores, and user acquisition rates to understand market demand and satisfaction. Financial metrics evaluate profit margins, operational expenditure, and overall return on investment for strategic initiatives.
Risk management and time-to-market are also critical business measurements. Reducing operational risk protects brand reputation and avoids costly regulatory penalties. Accelerating time-to-market allows companies to capture new revenue streams before competitors. Practical examples of business KPIs include monthly recurring revenue, customer churn rate, gross profit margins, operational cost per transaction, and customer acquisition cost.
DevOps KPIs vs Business KPIs
| Area | DevOps KPI | Business KPI | Why the Connection Matters |
| Delivery Speed | Deployment Frequency | Time-to-Market | Faster deployments enable quicker feature releases, reducing time-to-market for new revenue opportunities. |
| Reliability | Mean Time to Recovery (MTTR) | Customer Retention | Rapid recovery minimizes service downtime, preserving customer trust and preventing churn. |
| Quality | Change Failure Rate | Customer Satisfaction | Lower failure rates mean fewer user-facing bugs, directly improving user experience and satisfaction ratings. |
| Cost | Infrastructure Utilization | Gross Profit Margins | Optimized cloud resource usage reduces hosting expenditures, improving overall profitability. |
| Security | Vulnerability Remediation Time | Risk Reduction | Quick security patching protects sensitive data, preventing costly breaches and compliance fines. |
| Customer Experience | System Availability | Net Promoter Score (NPS) | High uptime ensures consistent service delivery, driving positive customer sentiment and brand loyalty. |
| Productivity | Lead Time for Changes | Operational Efficiency | Shorter lead times reduce waste and labor overhead, allowing teams to deliver more value with existing resources. |
| Risk | Incident Volume | Brand Reputation | Fewer production incidents safeguard brand integrity and maintain customer confidence in the platform. |
DevOps KPIs measure engineering signals, while Business KPIs measure organizational outcomes. DevOps metrics tell you how well your technical systems and delivery pipelines are functioning. Business metrics tell you how well the enterprise is satisfying its customers and generating value. Neither set of metrics can provide a complete picture of organizational health on its own.
Why DevOps KPIs Alone Are Not Enough
Focusing exclusively on technical metrics often leads organizations into the trap of tracking vanity metrics. Engineering teams can easily increase deployment frequency by breaking large features into tiny, meaningless commits. While this improves raw technical numbers, it does not deliver any tangible value to the end user.
Optimization without business context frequently causes tension between speed and quality. Pushing code rapidly into production without adequate verification can increase the number of outages. High deployment volume loses its meaning if those deployments introduce regressions that frustrate customers and drain support resources.
Infrastructure efficiency improvements can similarly become misaligned with business requirements. Automating a server provisioning process saves labor hours, but if the underlying application architecture no longer serves customer demand, the automation effort yields minimal business impact. Technical improvements must always be evaluated in the context of broader organizational goals.
Key DevOps KPIs Every Team Should Understand
Deployment Frequency
Deployment frequency measures how often code is successfully released to production environments. This metric indicates the agility of the delivery pipeline and the team’s ability to release small, incremental updates. High deployment frequency usually reflects robust automated testing and continuous integration practices.
Lead Time for Changes
Lead time for changes tracks the total duration required for a code commit to reach production. This metric exposes bottlenecks in the software development lifecycle, including code review delays, manual testing phases, and release approval gates. Shorter lead times enable rapid iteration and experimentation.
Change Failure Rate
Change failure rate calculates the percentage of deployments that result in degraded service, require immediate hotfixes, or cause production incidents. This metric highlights the reliability and stability of the release process. A rising failure rate indicates deficiencies in automated testing, code quality, or deployment validation.
Mean Time to Recovery
Mean time to recovery measures how long it takes for a team to restore service after a disruption or failure occurs. This metric reflects the effectiveness of monitoring, alerting, troubleshooting processes, and incident management workflows. Fast recovery minimizes user impact during outages.
Availability
Availability measures the percentage of time that a service is operational and accessible to users. This metric serves as a foundational indicator of reliability. High availability builds customer trust and ensures uninterrupted business operations.
Incident Volume
Incident volume tracks the total number of operational issues reported by monitoring systems or users over a specific period. This metric reveals underlying system instability and technical debt. Monitoring incident trends helps teams prioritize architectural refactoring.
| DevOps KPI | What It Measures | Possible Business Connection |
| Deployment Frequency | How often code is released to production | Faster feature delivery and improved market responsiveness |
| Lead Time for Changes | Time from commit to production release | Reduced operational overhead and faster time-to-market |
| Change Failure Rate | Percentage of failed production deployments | Enhanced product quality and higher customer satisfaction |
| Mean Time to Recovery | Time required to restore service after failure | Minimized revenue loss and preserved customer trust |
| System Availability | Percentage of time services remain operational | Consistent user experience and reduced churn |
| Incident Volume | Total number of operational disruptions | Lower support costs and improved system reliability |
Important Business KPIs for DevOps Teams
Customer satisfaction and retention are paramount business outcomes influenced by software quality. When systems run reliably and features arrive promptly, users are far more likely to continue their subscriptions and recommend the platform to others.
Revenue impact and cost efficiency represent critical financial dimensions. Engineering teams directly influence operational costs through cloud resource management and automation. Efficient infrastructure usage lowers cost per transaction, expanding profit margins.
Time-to-market and service adoption metrics determine competitive advantage. Releasing innovative features ahead of competitors captures market share. Understanding these business outcomes allows technical teams to prioritize projects that drive enterprise value.
Mapping DevOps KPIs to Business KPIs
| DevOps KPI | Business KPI | Example Connection |
| Shorter Lead Time | Time-to-Market | Releasing features faster helps capture seasonal market demand ahead of competitors. |
| Lower Change Failure Rate | Customer Retention | Fewer production bugs prevent user frustration, directly decreasing customer churn rates. |
| Faster Recovery (MTTR) | Revenue Impact | Rapid restoration of checkout services minimizes lost sales during peak traffic windows. |
| Improved Automation | Operational Cost | Automated provisioning reduces manual infrastructure management labor and lowers overhead. |
| Higher Availability | Customer Satisfaction | Consistent uptime improves user trust and elevates Net Promoter Scores over time. |
Correlation does not automatically prove causation. An increase in deployment frequency might coincide with higher revenue, but that does not mean deployments caused the revenue jump. External factors such as marketing campaigns, seasonal trends, or macroeconomic shifts often influence business results. Engineering teams should interpret metrics within their proper context rather than assuming direct, isolated cause-and-effect relationships.
Building a DevOps KPI Framework
Creating an effective measurement framework requires working backward from high-level enterprise objectives rather than collecting technical metrics at random.
- Business Goal: Define the overarching strategic objective, such as expanding market share or improving customer retention.
- Business KPI: Select the specific metric that tracks progress toward that goal, such as customer churn rate.
- Engineering Outcome: Determine how technical teams can contribute to that goal, such as reducing application downtime.
- DevOps KPI: Choose the technical metric that measures that contribution, such as system availability and mean time to recovery.
- Action: Implement targeted engineering improvements, such as adding automated failover mechanisms.
- Measurement: Track changes in both the technical and business metrics over time to evaluate effectiveness.
Example: Connecting DevOps Metrics to Business Outcomes
Consider an e-commerce organization experiencing declining customer satisfaction scores and rising complaint volumes. Management wants to understand how technical performance contributes to this customer experience problem.
The engineering team analyzes availability, incident volume, change failure rate, and recovery time. They discover that recent releases introduced frequent payment gateway errors, causing checkout failures during peak evening shopping hours.
The team connects these technical failures directly to customer complaints, cart abandonment rates, and lost revenue. By focusing on lowering their change failure rate and improving automated testing around payment flows, they stabilize the platform. Over the next quarter, customer complaints decrease, checkout completion rates rise, and revenue recovers, proving the value of aligning DevOps metrics with business realities.
DevOps KPI Dashboard
| Category | KPI | Measurement Purpose |
| Delivery | Deployment Frequency | Track release velocity and pipeline efficiency |
| Delivery | Lead Time for Changes | Measure end-to-end delivery speed |
| Reliability | Availability | Monitor overall service uptime |
| Reliability | MTTR | Evaluate incident response and recovery efficiency |
| Quality | Change Failure Rate | Assess release stability and regression control |
| Cost | Infrastructure Cost | Track cloud resource expenditure and efficiency |
| Security | Security Findings | Measure vulnerability exposure and patching speed |
| Business | Customer Satisfaction | Track user sentiment and platform adoption |
| Business | Time-to-Market | Evaluate feature delivery speed relative to competitors |
Dashboards should always be tailored to specific audiences. Executives need high-level summaries of cost, revenue impact, and reliability. Engineering managers require visibility into team velocity, bottlenecks, and quality trends. Individual engineers need granular telemetry data to troubleshoot systems and optimize code execution.
KPI Framework for Different Roles
| Role | Important DevOps KPIs | Important Business Context |
| DevOps Engineer | Deployment Frequency, Lead Time | Pipeline efficiency and resource utilization |
| SRE | Availability, MTTR, Incident Volume | Service reliability and customer impact mitigation |
| Engineering Manager | Change Failure Rate, Team Velocity | Project delivery timelines and resource allocation |
| Product Manager | Time-to-Market, Feature Adoption | Revenue generation and customer satisfaction |
| CTO / Business Leader | Cost Efficiency, Risk, Business ROI | Enterprise growth, profitability, and strategic alignment |
Different roles require varying levels of measurement abstraction. Technical staff need granular metrics to fix immediate problems. Leadership needs aggregated indicators to make informed investment and strategic decisions.
Common Mistakes When Measuring DevOps KPIs
Measuring everything available creates information overload, distracting teams from what truly matters. Focusing exclusively on deployment frequency often encourages reckless releases that degrade system stability. Treating speed as the sole goal ignores quality, security, and customer experience.
Ignoring reliability metrics in favor of pure delivery speed frequently leads to catastrophic outages. Comparing disparate teams unfairly using raw metrics demoralizes staff, as different applications have unique architectural constraints. Using metrics for employee surveillance destroys psychological safety and encourages gaming the system. Setting unrealistic targets without baseline data causes frustration and burnout.
To solve these issues, focus on a small, curated set of metrics. Always review trends over time rather than isolated snapshots. Emphasize collaboration and continuous learning over punitive scorecards.
How to Avoid Vanity Metrics
Vanity metrics look impressive on reports but offer no actionable insight into business or engineering health. Examples include counting the total number of deployments, commits, lines of code written, tickets closed, or pipeline runs executed. Volume alone does not represent value. A team can execute thousands of pipeline runs without delivering a single useful feature to a customer.
A better measurement approach focuses on outcomes rather than activity. Instead of tracking how many lines of code were written, measure how efficiently user requests are fulfilled. Instead of counting commits, track lead time and feature adoption rates. Emphasize quality, reliability, and user value over raw operational volume.
Real-World Case Study
An enterprise financial technology organization accelerated its software delivery pipeline significantly, doubling its deployment frequency within six months. Management celebrated the improvement in technical velocity.
However, business outcomes stagnated. Customer acquisition costs rose, and user complaints regarding transaction failures increased. The initial DevOps metrics showed great success, but the business problem remained unaddressed.
An investigation revealed a serious KPI mismatch. The team was optimizing for speed while ignoring quality and error rates in legacy integration modules. The engineering leadership updated their measurement strategy, introducing business-aligned DevOps metrics that tied deployment success directly to transaction accuracy and customer retention. By slowing down release cadences for legacy components and investing in robust automated testing, the team improved stability, reduced customer friction, and restored business growth.
How to Create Business-Aligned DevOps Goals
- Identify Business Objective: Understand the strategic goal set by leadership, such as increasing user engagement.
- Define Business KPI: Establish the metric that tracks that goal, such as daily active users.
- Identify Engineering Contribution: Determine how technical performance supports the objective, such as reducing page load latency.
- Select DevOps KPI: Choose the corresponding technical metric, such as system response time and availability.
- Establish Baseline: Measure current performance accurately before implementing changes.
- Set Realistic Improvement Goals: Define achievable targets for metric improvement over a specific timeframe.
- Review Results: Evaluate progress regularly through collaborative reviews.
- Adjust Strategy: Refine technical initiatives based on observed business and operational outcomes.
Best Practices for Measuring DevOps and Business KPIs
Start all measurement initiatives with clear business goals in mind. Keep the number of tracked KPIs limited to prevent cognitive overload. Measure trends over time rather than reacting to single data points. Combine speed and stability metrics to ensure balanced performance.
Always include customer impact in your evaluation criteria. Review metrics regularly during retrospectives and planning sessions. Avoid using metrics to foster toxic competition between teams. Use data strictly as a tool for continuous improvement and learning. Maintain complete transparency across engineering and business units.
DevOps KPI Learning Roadmap
- DevOps Fundamentals: Understand core cultural philosophies, automation principles, and collaboration practices.
- Software Delivery Lifecycle: Learn how code moves from development environments to production.
- CI/CD: Master continuous integration and continuous delivery pipeline implementation.
- Reliability Engineering: Study resilience patterns, error budgets, and operational stability.
- Observability: Gain expertise in logging, metrics, tracing, and system telemetry.
- DevOps Metrics: Learn how to measure delivery speed and operational reliability effectively.
- Business Metrics: Understand financial terms, revenue drivers, and customer success indicators.
- KPI Correlation: Connect technical measurements directly to organizational outcomes.
- Business-Aligned Engineering Strategy: Design holistic measurement frameworks that drive enterprise success.
Career Value of Understanding DevOps and Business KPIs
| Role | KPI Skills That Matter |
| DevOps Engineers | Connecting automation efforts to deployment velocity and resource savings. |
| SREs | Linking reliability metrics to customer retention and uptime commitments. |
| Engineering Managers | Balancing delivery speed with system stability and budget constraints. |
| Platform Engineers | Measuring internal developer productivity and platform adoption rates. |
| Technical Leaders | Aligning engineering roadmaps with enterprise revenue and growth goals. |
| Product Managers | Using technical metrics to forecast delivery timelines and feature availability. |
Senior technical professionals who understand business context alongside technical performance become invaluable organizational assets. Bridging the communication gap between engineering and executive leadership opens doors to strategic decision-making roles.
Frequently Asked Questions
What are DevOps KPIs?
DevOps KPIs are quantifiable technical metrics used to evaluate the speed, stability, security, and efficiency of software delivery and infrastructure operations.
What are Business KPIs?
Business KPIs are strategic measurements used by leadership to evaluate an organization’s overall financial health, operational efficiency, and market performance.
What is the difference between DevOps KPIs and Business KPIs?
DevOps KPIs measure internal engineering signals like delivery speed and system reliability, while Business KPIs measure external organizational outcomes like revenue, cost efficiency, and customer satisfaction.
Which DevOps KPIs are most important?
Key DevOps KPIs include deployment frequency, lead time for changes, change failure rate, mean time to recovery, and system availability.
What are common Business KPIs?
Common business KPIs include customer retention rate, monthly recurring revenue, operational cost per transaction, and time-to-market.
How can DevOps KPIs affect business performance?
Improving delivery speed and reliability helps organizations release features faster, reduce downtime, lower operational costs, and improve customer satisfaction.
Is deployment frequency a Business KPI?
No, deployment frequency is a technical DevOps KPI because it measures internal engineering delivery velocity rather than direct business outcomes.
Why should technical metrics be connected to customer outcomes?
Connecting technical metrics to customer outcomes ensures that engineering effort actually contributes to user satisfaction and enterprise value rather than internal vanity goals.
What is a vanity metric?
A vanity metric is a measurement that looks impressive on reports, such as raw commit counts or pipeline runs, but offers no actionable insight into actual business or engineering health.
How should engineering teams choose KPIs?
Teams should work backward from strategic business goals, selecting a small set of technical metrics that directly support those objectives.
Should DevOps teams be measured by revenue?
DevOps teams should generally be measured by technical contributions that influence revenue, such as system availability and time-to-market, rather than direct sales targets.
How can beginners learn DevOps KPI management?
Beginners should study foundational CI/CD concepts, system observability, reliability engineering, and basic financial literacy through structured resources like DevOpsSchool.
Final Thoughts
Successful DevOps measurement is not about collecting the largest number of metrics or drowning dashboards in telemetry noise. Technical KPIs become truly valuable when they help engineering and business teams understand how code quality, delivery speed, and operational stability influence customer experience, revenue, cost, risk, and overall delivery value. Experienced technical leaders use metrics to foster collaboration, eliminate bottlenecks, and drive sustainable organizational growth.