







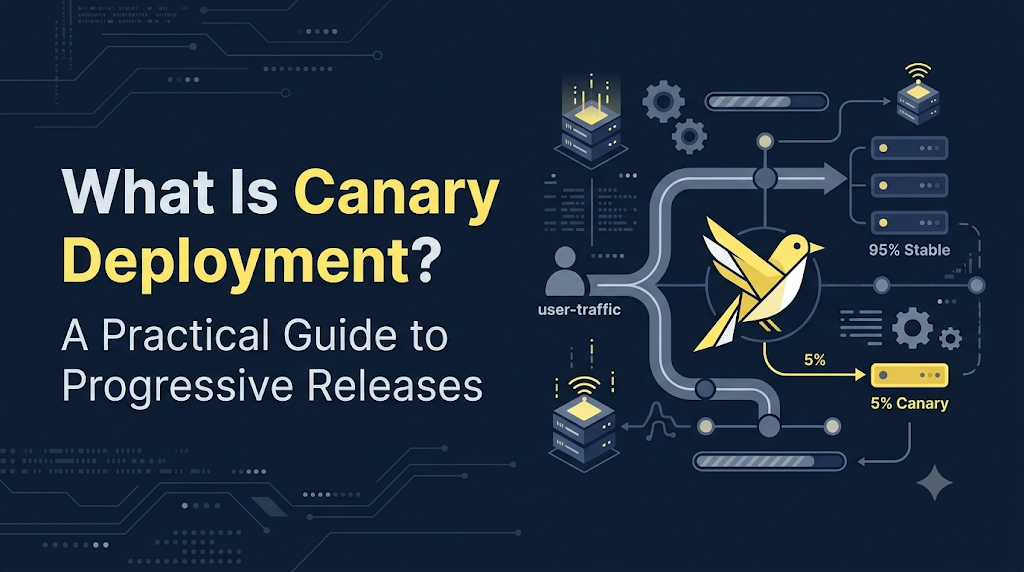
Releasing a new software update all at once is a high-stakes gamble: even after passing local tests and staging checks, unexpected bugs or edge-case data quirks can slip into production, immediately degrading the experience for 100% of your active users. Canary deployment eliminates this all-or-nothing risk by releasing the update to just a tiny slice of live traffic—often 2% to 5%—alongside the battle-tested version, allowing teams to catch regressions and evaluate performance under real-world conditions before a broader rollout. Mastering these progressive delivery and traffic-routing strategies is essential for modern software delivery, and resources like DevOpsSchool offer valuable guidance for engineers and teams looking to adopt safer, data-driven deployment workflows.
What Is Canary Deployment?
At its core, a canary deployment is a release strategy where a new version of software is deployed to a small subset of production infrastructure or exposed to a tiny fraction of user traffic alongside the existing stable version.
The name traces its roots to historical coal mining. Before modern electronic air sensors existed, miners carried a caged canary down into subterranean tunnels. Because canaries are far more sensitive to toxic gases like carbon monoxide and methane than humans, any distress shown by the bird served as an early warning system, signaling miners to evacuate immediately. In software delivery, your new application build is the canary: exposing it to a small volume of live traffic provides an early warning signal of architectural flaws, memory leaks, or logical bugs before the rest of your fleet is compromised.
                    ┌─────────────────────────┐
                    │  Incoming User Traffic  │
                    └────────────┬────────────┘
                                 │
                     [ Traffic Router / Ingress ]
                                 │
                 ┌───────────────┴───────────────┐
                 │ (95% Traffic)                 │ (5% Traffic)
                 ▼                               ▼
       ┌───────────────────┐           ┌───────────────────┐
       │   Stable (v1.0)   │           │   Canary (v2.0)   │
       │  Production Fleet │           │  Isolated Pods    │
       └─────────┬─────────┘           └─────────┬─────────┘
                 │                               │
                 └───────────────┬───────────────┘
                                 ▼
                     [ Observability Engine ]
                  (Metrics, Latency, Error Rates)
In a canary deployment:
- Parallel Execution: The current production version (stable) and the new version (canary) run concurrently in the production environment.
- Selective Routing: A load balancer, API gateway, or service mesh directs a small, configurable portion of incoming traffic to the canary instances while the overwhelming majority flows to the stable instances.
- Controlled Shifting: Over a defined evaluation window, operators or automated control loops monitor the canary’s performance against predefined health criteria. If metrics look healthy, traffic allocation increases sequentially (e.g., from 5% to 15%, 50%, and ultimately 100%).
- Fast Rollback: If the canary exhibits anomalies—such as elevated HTTP 5xx responses, high latency, or increased CPU consumption—traffic routing immediately shifts 100% back to the stable instances, and the canary version is retired.
It is critical to clarify that a canary deployment is a release and traffic-routing strategy, not simply a backup application server. Simply spinning up a second VM or container running new code does not constitute a canary deployment. The defining characteristics are the selective, measured division of live production traffic, rigorous baseline comparison, and incremental progression toward complete rollout.
Follow the Traffic: How a Canary Release Works
To understand canary deployments in practice, let us walk through the complete deployment lifecycle step-by-step.
+-------------+     +-------------+     +-------------+     +-------------+
| 1. Baseline | --> | 2. Deploy   | --> | 3. Route    | --> | 4. Monitor  |
| Stable v1.0 |     | Canary v2.0 |     | 5% Traffic  |     | & Compare   |
+-------------+     +-------------+     +-------------+     +-------------+
                                                                   │
       ┌─────────────────── Rollback Path <────────────────────────┤
       ▼                                                           ▼
+-------------+                                             +-------------+
| Abort v2.0  |                                             | 5. Advance  |
| Route 100%  |                                             | Traffic to  |
| Back to v1  |                                             | 25% -> 100% |
+-------------+                                             +-------------+
Step 1: Establish the Stable Baseline
The existing application version (v1.0) serves 100% of user traffic. Observability systems track key performance indicators (KPIs) such as baseline latency, error counts, CPU usage, and request throughput. This baseline provides the benchmark against which the new version will be judged.
Step 2: Prepare and Deploy the Canary Version
The continuous integration (CI) pipeline compiles, tests, and builds the container image for the updated version (v2.0). The deployment system provisions an isolated set of application instances running v2.0 within the production infrastructure. Crucially, at this initial moment, the canary instances receive zero public traffic while internal health checks and startup probes confirm they are running properly.
Step 3: Route Initial Traffic
The traffic router (such as an ingress controller or service mesh) updates its routing table. It begins routing a modest, controlled fraction of traffic—typically 2% to 5%—to the canary instances. The remaining 95% to 98% continues hitting v1.0 without disruption.
Step 4: Monitor and Observe
Both versions are actively evaluated using real production workloads. The telemetry system tracks critical metrics:
- HTTP 4xx/5xx status codes
- P95 and P99 latency percentiles
- System resource utilization (memory footprint, CPU throttling)
- Database connection pools and external dependency timeouts
Step 5: Direct Metric Comparison
Engineers or automated delivery controllers compare the telemetry of v2.0 directly against v1.0. Because both versions are experiencing the same live environmental conditions, variations in performance can be attributed directly to code or configuration differences between v1.0 and v2.0.
Step 6: Progressive Traffic Shifting
If the canary runs without errors during the initial observation window (e.g., 15 to 30 minutes), the traffic allocation steps up—say, from 5% to 25%, and then to 50%. A new observation period begins at each step to ensure the canary handles higher concurrency without degradation.
Step 7: Final Rollout or Clean Rollback
- Promotion: Once the canary reaches 100% of traffic and passes final validation checks, the v1.0 instances are safely decommissioned or updated to v2.0. The canary build officially becomes the new stable baseline.
- Rollback: If metrics breach predefined error thresholds at any evaluation step, traffic is immediately reverted to 100% on v1.0. The canary pods are isolated for root-cause analysis, and no further user requests hit the broken version.
What Makes Canary Deployment Different From Other Strategies?
DevOps teams have several strategies at their disposal when updating software. Understanding the operational differences helps you select the right pattern for your architecture.
| Deployment Strategy | Traffic Routing Control | Infrastructure Footprint | Rollback Speed | Operational Complexity | Primary Use Case |
| Canary Deployment | Fine-grained percentage-based splitting (e.g., 5%, 20%, 100%) | Low to moderate; scales incrementally alongside stable | Near-instantaneous (shift router weights back to stable) | High; requires advanced ingress, routing, and metric analysis | High-traffic services, mission-critical APIs, risk-averse systems |
| Rolling Deployment | Coarse; determined by the ratio of new to old instances during rollout | Minimal; uses existing cluster capacity by replacing nodes/pods progressively | Moderate; requires rolling back through sequential instance replacements | Low to moderate; natively supported by Kubernetes and orchestrators | General-purpose microservices where transient minor errors are tolerable |
| Blue-Green Deployment | All-or-nothing binary switch (100% Blue to 100% Green) | High; requires doubling production infrastructure capacity during cutover | Instantaneous; switch router or DNS back to the inactive environment | Moderate; managing two identical parallel production stacks | Monolithic applications, environments where version mixing is strictly forbidden |
| Recreate Deployment | None; service is stopped before the new version starts | Minimal; uses the exact same compute capacity | Slow; requires tearing down the new build and reinstalling the old | Very low; basic script execution | Development environments, batch processors, systems where downtime is acceptable |
| Feature Flags | Application-level; targeted by user ID, geography, or role | Minimal; both code paths exist inside the exact same deployed artifact | Instantaneous; toggle flag state in centralized configuration service | High code complexity; creates technical debt and branching code paths | A/B testing, user-specific feature previews, decoupled feature enablement |
Deep-Dive Comparisons
Canary vs. Rolling Deployment
In a standard Kubernetes RollingUpdate, old pods are terminated one by one as new pods achieve Ready status. While this avoids complete downtime, all incoming traffic that hits newly provisioned pods runs the new code immediately. If that code contains a subtle memory leak or an unhandled exception, every replacement pod introduces that failure across a wider swath of users until the entire fleet is degraded. Rolling updates lack granular percentage-based traffic steering and deep telemetry-driven promotion gates.
Canary vs. Blue-Green Deployment
Blue-green deployment spins up an entirely duplicate production environment (Green) alongside the active one (Blue). Once Green is verified via internal smoke tests, the router or DNS flips 100% of user traffic from Blue to Green. While this allows rapid rollback by flipping the router back, it is an “all-or-nothing” switch. The very first live user request on Green tests the entire production load. Furthermore, maintaining two fully provisioned, production-grade infrastructure environments significantly increases cloud infrastructure costs.
Canary vs. Feature Flags
Feature flags (feature toggling) evaluate conditions inside the application runtime code (e.g., if (user.hasFeatureX()) { ... }). While they allow fine-grained access control at the user or session level, they require developers to embed conditional branches directly into the business logic. Canary deployments operate at the infrastructure and networking layer, deploying clean, decoupled artifacts without cluttering the application source code with release-management flags.
The Technology Behind Canary Deployments
Implementing an automated canary architecture requires coordinating infrastructure management, dynamic traffic routing, automated pipelines, and continuous telemetry collection. Modern teams use a combination of specialized open-source and cloud-native tools to achieve this.
       [ Developer Commit ]
                 │
                 ▼
       ┌───────────────────┐
       │ CI/CD Automation  │  GitHub Actions / Jenkins
       │ (Build & Package) │
       └─────────┬─────────┘
                 │
                 ▼
       ┌───────────────────┐
       │ Deployment Engine │  Kubernetes + Argo Rollouts
       │ (Pod Orchestration)
       └─────────┬─────────┘
                 │
                 ▼
       ┌───────────────────┐
       │ Dynamic Traffic   │  NGINX Ingress / Istio Service Mesh
       │ (Percentage Split)│
       └─────────┬─────────┘
                 │
                 ▼
       ┌───────────────────┐
       │ Telemetry & Viz   │  Prometheus (Metrics) + Grafana (Dashboards)
       │ (Analysis Engine) │
       └───────────────────┘
- Kubernetes (Workload Orchestration): The standard container orchestrator provides declarative APIs to run multiple revisions of an application simultaneously. It isolates workloads, governs resource allocations, and executes lifecycle hooks.
- NGINX Ingress Controller (Traffic Routing): A widely adopted ingress solution that uses annotations (such as
nginx.ingress.kubernetes.io/canary) to split incoming HTTP/S traffic by weight, header values, or cookies without requiring external load balancers. - Istio (Service Mesh): In complex microservice architectures where services talk to one another internally (east-west traffic), Istio provides advanced traffic shaping via
VirtualServiceandDestinationRuleobjects, routing requests based on HTTP headers, URI paths, and granular percentages. - Argo Rollouts (Progressive Delivery Controller): A specialized Kubernetes operator that replaces the native
Deploymentresource with an advancedRolloutcustom resource. Argo Rollouts automates multi-step traffic shifting, connects directly to metric providers, runs analysis templates, and triggers automated rollbacks without manual intervention. - Prometheus (Metric Collection): A time-series database that scrapes application metrics (e.g., exposed via
/metricsendpoints), recording request rates, HTTP 500 error counts, and process memory utilization across both stable and canary pods. - Grafana (Visualization & Dashboards): Provides visual dashboards displaying real-time comparisons between stable and canary versions, giving SREs and engineering teams clear insight during active release windows.
- Jenkins & GitHub Actions (CI/CD Pipelines): The automation engines that build application container images, execute static security analysis, update manifest repositories (GitOps), and trigger the initial canary rollout.
Design a Reliable Canary Deployment Architecture
A dependable canary architecture requires several interconnected components working in harmony. If any single component is missing—such as observability or dynamic routing—the safety guarantees of the canary pattern break down.
                     ┌────────────────────────────────┐
                     │          Public DNS            │
                     └───────────────┬────────────────┘
                                     │
                                     ▼
                     ┌────────────────────────────────┐
                     │    Edge Ingress / Gateway      │
                     │  (e.g., NGINX / Cloud ALB)     │
                     └───────────────┬────────────────┘
                                     │  (Dynamic Weight Distribution)
                     ┌───────────────┴────────────────┐
                     │                                │
                     ▼ (90%)                          ▼ (10%)
       ┌───────────────────────────┐    ┌───────────────────────────┐
       │    Stable Service (v1)    │    │    Canary Service (v2)    │
       └─────────────┬─────────────┘    └─────────────┬─────────────┘
                     │                                │
                     ▼                                ▼
       ┌───────────────────────────┐    ┌───────────────────────────┐
       │      Stable Pod Pool      │    │      Canary Pod Pool      │
       │   [App]   [App]   [App]   │    │           [App]           │
       └─────────────┬─────────────┘    └─────────────┬─────────────┘
                     │                                │
                     └────────────────┬───────────────┘
                                      │
                   Telemetry Emission │ (Logs, Traces, Metrics)
                                      ▼
                     ┌────────────────────────────────┐
                     │ Observability & Analysis Plane │
                     │   (Prometheus, Grafana, Logs)  │
                     └────────────────┬───────────────┘
                                      │
                                      ▼ (Automated Decision)
                     ┌────────────────────────────────┐
                     │  Progressive Delivery Engine   │
                     │   (Argo Rollouts Controller)   │
                     │  - Continue to 25%             │
                     │  - Abort and Route 100% Stable │
                     └────────────────────────────────┘
Core Architectural Components
- Stable Application Instances: The baseline fleet running the current production version. It handles the vast majority of user traffic and maintains business continuity while new code is validated.
- Canary Application Instances: The target fleet running the new application version. Deployed in smaller numbers, these instances must use identical configuration parameters, environment variables, and compute limits as the stable fleet to ensure accurate testing conditions.
- Traffic Router / Load Balancer: The networking component responsible for enforcing dynamic traffic distribution. It must be capable of weight-based routing (e.g., sending 5% of requests to Service B and 95% to Service A) rather than simple round-robin balancing across all pods.
- Monitoring & Observability Plane: A telemetry pipeline capturing golden signals—latency, traffic, errors, and saturation. Without continuous metric ingestion, evaluating whether the canary is successful is reduced to guesswork.
- Automated Deployment Pipeline: A workflow engine that manages the release sequence, tracking execution status, waiting for analysis windows to complete, and orchestrating downstream steps.
- Health Checks & Probes: Liveness, readiness, and startup probes that prevent traffic from reaching any canary pod until it has initialized dependencies, established database connections, and warmed internal caches.
- Rollback Mechanism: An automated mechanism to instantly reset traffic routing weights to 0% for the canary version upon metric failure.
- Release Approval Controls: Gatekeeping systems that allow fully automated promotions for minor updates while requiring manual sign-offs from engineering leads before major architectural updates transition to 100% production traffic.
Build a Canary Deployment Using Kubernetes
While standard Kubernetes Service definitions can balance traffic across multiple pods using label selectors, they cannot perform precise percentage-based traffic splits. For example, if you run 9 stable pods and 1 canary pod behind a single Kubernetes Service, each pod receives an equal share of traffic—giving the canary roughly 10% of total requests. However, this approach ties your traffic distribution directly to pod counts, which wastes compute resources and makes fine-grained control (like 1% or 2% splits) impractical.
A cleaner, more professional approach utilizes an Ingress Controller capable of weight-based traffic management, such as the NGINX Ingress Controller.
Prerequisites
- A running Kubernetes cluster (v1.24+ like Minikube, Kind, or a managed cloud cluster).
kubectlconfigured to interact with your cluster.- NGINX Ingress Controller installed and running.
Step 1: Deploy the Stable Application Version (v1)
Save the following manifest as app-v1-stable.yaml. It creates a Deployment running an initial version of an application along with a dedicated Kubernetes ClusterIP Service.
YAML
apiVersion: apps/v1
kind: Deployment
metadata:
  name: web-app-stable
  labels:
    app: web-app
    version: v1.0.0
spec:
  replicas: 3
  selector:
    matchLabels:
      app: web-app
      version: v1.0.0
  template:
    metadata:
      labels:
        app: web-app
        version: v1.0.0
    spec:
      containers:
      - name: web-container
        image: hashicorp/http-echo:0.2.3
        args:
        - "-text=Serving from Version 1.0.0 (Stable Production)"
        ports:
        - containerPort: 5678
        readinessProbe:
          httpGet:
            path: /
            port: 5678
          initialDelaySeconds: 2
          periodSeconds: 5
---
apiVersion: v1
kind: Service
metadata:
  name: web-app-stable-svc
spec:
  type: ClusterIP
  ports:
  - port: 80
    targetPort: 5678
  selector:
    app: web-app
    version: v1.0.0
Apply the stable deployment:
Bash
kubectl apply -f app-v1-stable.yaml
Step 2: Deploy the Primary Production Ingress
Save the following manifest as ingress-primary.yaml. This routes standard public traffic coming to app.example.com directly to our stable service.
YAML
apiVersion: networking.k8s.io/v1
kind: Ingress
metadata:
  name: web-app-primary-ingress
  annotations:
    kubernetes.io/ingress.class: "nginx"
spec:
  rules:
  - host: app.example.com
    http:
      paths:
      - path: /
        pathType: Prefix
        backend:
          service:
            name: web-app-stable-svc
            port:
              number: 80
Apply the primary ingress:
Bash
kubectl apply -f ingress-primary.yaml
Step 3: Deploy the Canary Application Version (v2)
Now, prepare the updated version of the application. Save this configuration as app-v2-canary.yaml. Notice it runs fewer replicas and possesses distinct version labels.
YAML
apiVersion: apps/v1
kind: Deployment
metadata:
  name: web-app-canary
  labels:
    app: web-app
    version: v2.0.0
spec:
  replicas: 1
  selector:
    matchLabels:
      app: web-app
      version: v2.0.0
  template:
    metadata:
      labels:
        app: web-app
        version: v2.0.0
    spec:
      containers:
      - name: web-container
        image: hashicorp/http-echo:0.2.3
        args:
        - "-text=Serving from Version 2.0.0 (Canary Release)"
        ports:
        - containerPort: 5678
        readinessProbe:
          httpGet:
            path: /
            port: 5678
          initialDelaySeconds: 2
          periodSeconds: 5
---
apiVersion: v1
kind: Service
metadata:
  name: web-app-canary-svc
spec:
  type: ClusterIP
  ports:
  - port: 80
    targetPort: 5678
  selector:
    app: web-app
    version: v2.0.0
Apply the canary deployment:
Bash
kubectl apply -f app-v2-canary.yaml
Step 4: Configure Weight-Based Traffic Routing
To split traffic without altering pod counts, create a secondary Ingress annotated with NGINX canary controls. Save this as ingress-canary.yaml.
YAML
apiVersion: networking.k8s.io/v1
kind: Ingress
metadata:
  name: web-app-canary-ingress
  annotations:
    kubernetes.io/ingress.class: "nginx"
    nginx.ingress.kubernetes.io/canary: "true"
    nginx.ingress.kubernetes.io/canary-weight: "10"
spec:
  rules:
  - host: app.example.com
    http:
      paths:
      - path: /
        pathType: Prefix
        backend:
          service:
            name: web-app-canary-svc
            port:
              number: 80
How this configuration works:
nginx.ingress.kubernetes.io/canary: "true": Signals to the NGINX ingress controller that this ingress acts as an overlay filter for an existing host path.nginx.ingress.kubernetes.io/canary-weight: "10": Instructs the router to forward roughly 10% of random incoming requests hittingapp.example.comtoweb-app-canary-svc. The remaining 90% stays withweb-app-stable-svc.
Apply the canary routing rule:
Bash
kubectl apply -f ingress-canary.yaml
Step 5: Test and Validate Traffic Shifting
Simulate incoming user traffic using a shell loop. Use curl with the specified Host header:
Bash
for i in {1..20}; do
  curl -s -H "Host: app.example.com" http://<INGRESS_CONTROLLER_IP>/
done
Expected Output:
Plaintext
Serving from Version 1.0.0 (Stable Production)
Serving from Version 1.0.0 (Stable Production)
Serving from Version 1.0.0 (Stable Production)
Serving from Version 1.0.0 (Stable Production)
Serving from Version 2.0.0 (Canary Release)
Serving from Version 1.0.0 (Stable Production)
Serving from Version 1.0.0 (Stable Production)
Serving from Version 1.0.0 (Stable Production)
Serving from Version 1.0.0 (Stable Production)
Serving from Version 1.0.0 (Stable Production)
...
Out of twenty requests, approximately two return the Version 2.0.0 payload, confirming that our 10% weight is actively working.
Step 6: Step-Up Promotion or Instant Rollback
To Increase Canary Exposure:
Edit the annotation value inside ingress-canary.yaml to step up traffic:
YAML
nginx.ingress.kubernetes.io/canary-weight: "50"
Apply the change:
Bash
kubectl apply -f ingress-canary.yaml
Traffic shifts dynamically without dropping connections or restarting pods.
To Execute an Emergency Rollback:
If an issue is detected, immediately delete the canary ingress or set its weight to zero:
Bash
kubectl delete ingress web-app-canary-ingress
100% of user traffic instantly falls back to the stable v1.0 service. After traffic is safely routed away, scale the canary deployment down to investigate:
Bash
kubectl scale deployment web-app-canary --replicas=0
How to Know Whether the New Version Is Safe
Directing traffic to a canary build is useless if you cannot accurately measure how that build behaves under real conditions. Evaluating canary health requires tracking a balanced set of operational and business metrics.
+--------------------------------------------------------------------------+
|                        CANARY HEALTH EVALUATION                          |
+--------------------------------------------------------------------------+
|  [ Operational Metrics ]                  [ Infrastructure Metrics ]     |
|  - HTTP 5xx Status Rates                  - CPU Throttling               |
|  - P95 / P99 Latency Curves               - Memory Saturation & OOM      |
|  - Connection Pool Exhaustion             - Pod CrashLoopBackOffs        |
+--------------------------------------------------------------------------+
|  [ Business-Level Signals ]               [ Statistical Safeguards ]     |
|  - Checkout & Payment Conversions         - Sufficient Sample Size       |
|  - User Drop-off / Cart Abandonment       - Identical Production Baseline|
|  - Downstream Microservice Failures       - Noise Window Filters         |
+--------------------------------------------------------------------------+
Critical Signals to Monitor
- HTTP Error Rates (4xx and 5xx): A healthy canary should maintain an error rate equal to or lower than the stable baseline. An uptick in 500 (Internal Server Error), 502 (Bad Gateway), or 504 (Gateway Timeout) responses is an immediate red flag.
- Response Time and Latency Distributions: Always analyze tail latencies (P95 and P99 percentiles) rather than simple arithmetic averages. An average response time might look fine at 45ms, while the P99 latency spikes from 120ms to 2,500ms due to database locking or inefficient memory allocation.
- Request Throughput and Saturation: Monitor whether the canary processes requests at the expected rate without dropping incoming socket connections.
- Host System Metrics (CPU, Memory, Disk I/O): Watch for abnormal memory growth that could point to memory leaks. If canary memory usage climbs steadily without stabilizing, the application will eventually be terminated by the Kubernetes Out-Of-Memory (OOM) killer.
- Container Restarts and Crash Loops: Repeated container restarts triggered by failed liveness probes or unhandled panics clearly indicate an unhealthy release.
- Application Logging Anomalies: Ingest log streams into centralized search engines (such as Elasticsearch or OpenSearch) to flag increases in warning logs, stack traces, or uncaught exception reports.
- Business-Level Indicators: Technical health checks alone do not tell the whole story. A canary might return clean HTTP 200 responses while rendering an empty payment form that tanks checkout conversions. Whenever possible, compare domain-specific transactions between versions.
The Problem of Statistical Confidence
A common beginner mistake is evaluating canary performance with too little data. If your canary receives only five requests over a two-minute window and one fails, the error rate appears to be an alarming 20%. However, that failure might just be an atypical client disconnect rather than a bug in your code.
To ensure valid comparisons:
- Ensure the canary receives a statistically significant number of requests before drawing conclusions.
- Establish observation windows based on actual traffic volume—five minutes may suffice for a high-traffic service processing thousands of requests per second, while a lower-volume API might need an hour.
- Always compare canary performance directly against the stable version running in the exact same environment at the exact same time, rather than comparing against historical averages that might reflect different traffic patterns.
Automated Canary Analysis and Rollback
Manually reviewing dashboards and running curl commands works for basic examples, but it does not scale to engineering organizations deploying dozens of microservices daily. Modern platforms rely on Automated Canary Analysis (ACA) to systematically evaluate health metrics and make deployment decisions.
Advanced progressive delivery controllers like Argo Rollouts automate this lifecycle by replacing standard Kubernetes Deployments with declarative evaluation steps.
       [ Step 1: Set Weight 10% ]
                   │
                   ▼
       [ Step 2: AnalysisRun ] <──────── Prometheus Scrape
                   │
         ┌─────────┴─────────┐
         │ Metric Healthy?   │
         ▼                   ▼
       [ YES ]             [ NO ]
         │                   │
         ▼                   ▼
[ Step 3: Set Weight 50% ]  [ ABORT ROLLOUT ]
         │                  [ Set Weight 0% ]
         ▼
[ Step 4: Promote 100% ]
Example: Declarative Canary Rollout with Argo Rollouts
The following example defines an Argo Rollout resource that incrementally advances traffic while evaluating an automated metric template:
YAML
apiVersion: argoproj.io/v1alpha1
kind: Rollout
metadata:
  name: payment-service-rollout
spec:
  replicas: 10
  strategy:
    canary:
      canaryService: payment-service-canary
      stableService: payment-service-stable
      trafficRouting:
        nginx:
          stableIngress: payment-service-primary-ingress
      steps:
      - setWeight: 5
      - pause: { duration: 10m }
      - analysis:
          templates:
          - templateName: success-rate-check
      - setWeight: 20
      - pause: { duration: 20m }
      - analysis:
          templates:
          - templateName: success-rate-check
      - setWeight: 50
      - pause: { duration: 15m }
---
apiVersion: argoproj.io/v1alpha1
kind: AnalysisTemplate
metadata:
  name: success-rate-check
spec:
  metrics:
  - name: success-rate
    interval: 60s
    successCondition: result[0] >= 0.995
    failureLimit: 2
    provider:
      prometheus:
        address: http://prometheus-server.monitoring:9090
        query: |
          sum(rate(http_requests_total{app="payment-service",status!~"5.*"}[2m]))
          /
          sum(rate(http_requests_total{app="payment-service"}[2m]))
Anatomy of an Automated Promotion Rule
- Gradual Exposure: The rollout shifts 5% of traffic to the canary and pauses for 10 minutes to gather initial operational data.
- Automated Prometheus Queries: The
AnalysisTemplatequeries Prometheus every 60 seconds, calculating the percentage of successful (non-5xx) requests. - Threshold Enforcement: The
successCondition: result[0] >= 0.995requires a 99.5% success rate. - Failure Limits: The
failureLimit: 2allows a single transient blip. However, if the query fails two consecutive checks, the entire rollout is aborted automatically. Traffic drops back to 0% for the canary, the stable version retains 100% of traffic, and on-call teams receive a notification via webhook. - Threshold Realism: Thresholds must reflect the operational realities of the underlying service. Copying an arbitrary “99.99% success rate” rule onto an upstream aggregation API that routinely handles downstream client network drops will trigger false-positive rollbacks. Base your thresholds on established Service Level Objectives (SLOs).
Common Canary Deployment Problems
While canary deployments significantly reduce release risk, implementing them introduces architectural challenges. Understanding these common pitfalls helps teams troubleshoot issues effectively.
+--------------------------------------------------------------------------+
|                  COMMON CANARY DEPLOYMENT PITFALLS                       |
+--------------------------------------------------------------------------+
| 1. Sticky Sessions & Uneven Distribution -> Traffic bypasses canary     |
| 2. Database Schema Incompatibilities     -> v1 crashes on v2 schema      |
| 3. Insufficient Request Volume           -> False-positive analysis      |
| 4. Premature Readiness Reporting         -> Traffic hits unready pods   |
| 5. Stateful Data Divergence              -> Cache corruption & race cond |
+--------------------------------------------------------------------------+
1. Traffic Not Reaching the Canary Version
- Symptom: Deployments succeed, but observability dashboards show zero incoming requests hitting the canary pods.
- Root Cause: Misconfigured ingress annotations, unmatched Kubernetes service selectors, or missing host-header definitions.
- Fix: Inspect the underlying ingress routing tables using
kubectl describe ingress <name>. Verify that the canary labels match the selectors defined on your canary Service, and ensure your ingress controller has canary plugins enabled.
2. Uneven Traffic Distribution and Sticky Sessions
- Symptom: Canary traffic wildly exceeds or falls well short of your configured percentage (e.g., a 5% configuration yields 35% of total volume).
- Root Cause: Upstream load balancers or client session affinity settings (sticky cookies) lock existing users to specific pods. In enterprise environments, corporate proxies that multiplex thousands of internal users behind a single IP can also skew distribution.
- Fix: For canary releases, disable sticky sessions at the ingress layer or route traffic based on randomized request hashes instead of client IP addresses.
3. Increased Latency Across the Fleet
- Symptom: Deploying the canary causes overall application latency to increase, even for requests served by the stable version.
- Root Cause: Shared downstream resources. If the canary code introduces unindexed database queries or holds connection locks, the underlying database saturates, degrading performance across the entire fleet regardless of which application version serves the request.
- Fix: Monitor shared dependencies (such as primary databases and Redis caches) during rollouts. If back-end saturation spikes while the canary is running, roll back immediately and isolate the queries in a staging environment.
4. Database Schema Incompatibility
- Symptom: Deploying v2 causes the stable v1 application instances to suddenly fail with data-parsing errors.
- Root Cause: Breaking database migrations. If a v2 deployment deletes or renames a database column that v1 still relies on, the stable pods will crash even if only 2% of user traffic is routed to v2.
- Fix: Always use the Expand and Contract (Parallel Run) database migration pattern.
- Expand: Introduce new columns or tables alongside existing ones in a non-breaking way.
- Deploy: Run both v1 and v2 against the database simultaneously.
- Contract: Once v2 is fully rolled out and v1 is retired, drop the old columns in a subsequent cleanup migration.
5. Low Canary Traffic Volume Producing Inconclusive Data
- Symptom: Automated canary analysis routines continuously time out or report insufficient data to make promotion decisions.
- Root Cause: Splitting a small fraction of traffic (e.g., 2%) on a low-throughput internal API generates too few requests for meaningful statistical analysis.
- Fix: For low-traffic services, consider alternative routing strategies—such as using HTTP header matching (e.g., routing internal test accounts or QA users via a
X-Canary-Test: trueheader) to drive targeted traffic to the new version before opening it to general users.
6. Incorrect Health-Check Configurations
- Symptom: Canary pods are overwhelmed with traffic before they are ready, causing requests to fail immediately.
- Root Cause: A container readiness probe that returns HTTP 200 before the application has finished warming up caches or connecting to downstream services.
- Fix: Implement robust
readinessProbeandstartupProbedefinitions in your Kubernetes manifests. Ensure the probes accurately verify that the application can successfully process requests before the ingress controller adds the pod to the active routing pool.
When Should You Use Canary Deployment?
Canary deployments offer significant safety benefits, but they also require tooling and operational overhead. They are an excellent fit for many modern production environments, though simpler alternatives may make sense in certain scenarios.
                      [ Evaluate Your Service ]
                                  │
         ┌────────────────────────┴────────────────────────┐
         ▼                                                 ▼
[ High Traffic / Critical Path ]                [ Low Traffic / Internal ]
- High-volume customer APIs                     - Internal employee tools
- Payment and checkout flows                    - Offline batch processors
- Large microservice networks                   - Simple static websites
- Continuous release teams                      - Early-stage prototypes
         │                                                 │
         ▼                                                 ▼
[ USE CANARY DEPLOYMENT ]                       [ USE ROLLING OR RECREATE ]
Ideal Use Cases
- High-Throughput Web Applications: Consumer-facing services processing millions of daily requests benefit immensely from canary releases, where a 1% allocation exposes issues to thousands of real-world requests within minutes.
- Financial and Payment Platforms: Systems processing monetary transactions cannot afford wide-scale outages or subtle logic bugs. Incremental exposure protects core business revenue.
- Mission-Critical SaaS and APIs: For organizations maintaining strict Service Level Agreements (SLAs), canary releases provide a reliable way to catch regressions before they impact the broader customer base.
- Complex Microservices Environments: When distributed services communicate over networks, integration bugs can emerge in ways that unit tests cannot predict. Canary deployments validate changes against real service dependencies.
- High-Frequency Deployment Pipelines: Teams deploying multiple updates per day need automated, data-driven promotion gates rather than slow, manual testing cycles.
When a Simpler Strategy May Be Preferable
- Internal Tools with Low Concurrency: If an internal employee dashboard receives only a few requests an hour, a canary release will take days to collect enough data for meaningful analysis. A standard rolling update is often much more practical.
- Simple Static Websites: Content-focused sites without complex database dependencies or dynamic business logic generally do not warrant the infrastructure overhead of advanced canary routing.
- Offline Batch and Event Stream Processors: Background workers that consume from queues (like Kafka or RabbitMQ) cannot be split using standard HTTP-weight routing. They require specialized worker-scaling patterns instead.
- Early-Stage Prototypes: For greenfield projects and early MVPs where rapid iteration matters more than high availability, the operational complexity of service meshes and automated canary analysis is rarely justified.
Security and Operational Considerations
A progressive release strategy should strengthen your security posture, not weaken it. Running two versions of an application concurrently introduces unique operational and security considerations that teams must account for.
Secrets Management and Configuration Drift
Canary and stable versions must pull configuration variables and secrets from secure, centralized key-management systems (such as HashiCorp Vault or Kubernetes Secrets). Ensure the canary build does not accidentally point to development or staging databases; testing new code against non-production data stores invalidates your canary metrics and risks corrupting test environments.
Image and Dependency Vulnerability Scanning
Do not allow a container image to enter a canary pipeline simply because it passed code review. Automate static security analysis (SAST) and container image vulnerability scanning during the CI phase. Running a vulnerable canary pod in production exposes your cluster to security risks, even if that pod only handles 2% of incoming traffic.
Immutable Infrastructure and Configuration Parity
The compute, memory, and network settings for canary instances must match the stable fleet. If your stable pods have 4GB of memory and your canary is configured with 1GB, the canary may crash under load due to resource constraints rather than a bug in the code. Maintain parity across all environment variables, runtime configurations, and resource limits.
Version-to-Version Network Security Policies
In Kubernetes clusters using zero-trust networking via Cilium or Calico, verify that your NetworkPolicy objects apply to both stable and canary pods. If your policies select pods by specific version labels, you may inadvertently block the canary from reaching necessary databases or message brokers.
Audit Trails and Release Ownership
Automated pipelines must maintain clear audit logs detailing every canary action: who initiated the deployment, what commit SHA was deployed, which metrics were evaluated, what values were returned, and who (if anyone) approved promotions. Clear visibility ensures accountability and helps teams run effective post-mortems if issues arise.
A Practical Learning Exercise for DevOps Beginners
To see the canary pattern in action, walk through this practical hands-on lab using a local Kubernetes environment.
Lab Objectives
- Deploy a stable application (v1) and a canary application (v2) on a local cluster.
- Use NGINX Ingress annotations to split traffic 80/20.
- Simulate an application error inside the canary container.
- Observe the failure and execute a clean manual rollback.
Required Tools
- Minikube (installed and running).
- kubectl command-line utility.
- curl command-line utility.
Step 1: Prepare Minikube and Enable Ingress
Start your local Minikube cluster and enable the built-in NGINX Ingress Controller:
Bash
minikube start --driver=docker
minikube addons enable ingress
Wait until the ingress controller pods are fully initialized:
Bash
kubectl get pods -n ingress-nginx -w
Step 2: Deploy Both Application Versions
Save the following complete deployment specification as lab-canary-setup.yaml:
YAML
apiVersion: apps/v1
kind: Deployment
metadata:
  name: demo-app-v1
spec:
  replicas: 2
  selector:
    matchLabels:
      app: demo-app
      release: stable
  template:
    metadata:
      labels:
        app: demo-app
        release: stable
    spec:
      containers:
      - name: web
        image: hashicorp/http-echo:0.2.3
        args: ["-text=HTTP 200: Response from Stable Release v1"]
        ports:
        - containerPort: 5678
---
apiVersion: v1
kind: Service
metadata:
  name: demo-service-v1
spec:
  ports:
  - port: 80
    targetPort: 5678
  selector:
    app: demo-app
    release: stable
---
apiVersion: apps/v1
kind: Deployment
metadata:
  name: demo-app-v2
spec:
  replicas: 1
  selector:
    matchLabels:
      app: demo-app
      release: canary
  template:
    metadata:
      labels:
        app: demo-app
        release: canary
    spec:
      containers:
      - name: web
        image: hashicorp/http-echo:0.2.3
        args: ["-text=HTTP 500: Internal Server Error from Buggy Canary v2", "-status-code=500"]
        ports:
        - containerPort: 5678
---
apiVersion: v1
kind: Service
metadata:
  name: demo-service-v2
spec:
  ports:
  - port: 80
    targetPort: 5678
  selector:
    app: demo-app
    release: canary
Apply the deployments and services:
Bash
kubectl apply -f lab-canary-setup.yaml
Step 3: Establish Traffic Splitting Ingress
Save the following routing configuration as lab-ingress-split.yaml. This routes 20% of incoming requests to the faulty canary version.
YAML
apiVersion: networking.k8s.io/v1
kind: Ingress
metadata:
  name: demo-ingress-stable
  annotations:
    kubernetes.io/ingress.class: "nginx"
spec:
  rules:
  - host: demo.local
    http:
      paths:
      - path: /
        pathType: Prefix
        backend:
          service:
            name: demo-service-v1
            port:
              number: 80
---
apiVersion: networking.k8s.io/v1
kind: Ingress
metadata:
  name: demo-ingress-canary
  annotations:
    kubernetes.io/ingress.class: "nginx"
    nginx.ingress.kubernetes.io/canary: "true"
    nginx.ingress.kubernetes.io/canary-weight: "20"
spec:
  rules:
  - host: demo.local
    http:
      paths:
      - path: /
        pathType: Prefix
        backend:
          service:
            name: demo-service-v2
            port:
              number: 80
Apply the routing rules:
Bash
kubectl apply -f lab-ingress-split.yaml
Step 4: Send Test Traffic and Observe Errors
Find your Minikube IP address:
Bash
minikube ip
Run a loop to send 25 requests to the ingress router:
Bash
MINIKUBE_IP=$(minikube ip)
for i in {1..25}; do
  curl -s -i -H "Host: demo.local" http://${MINIKUBE_IP}/ | grep "HTTP/"
done
What You Will Observe:
You will see mostly HTTP/1.1 200 OK responses from the stable version, mixed with occasional HTTP/1.1 500 Internal Server Error responses (roughly 20% of the total) from the canary version:
Plaintext
HTTP/1.1 200 OK
HTTP/1.1 200 OK
HTTP/1.1 500 Internal Server Error   <-- Canary caught here!
HTTP/1.1 200 OK
HTTP/1.1 200 OK
Step 5: Execute an Emergency Rollback
The canary is returning 500 errors to users. Remove the canary ingress immediately to shut off traffic to the faulty version:
Bash
kubectl delete ingress demo-ingress-canary
Run the traffic loop again:
Bash
for i in {1..10}; do
  curl -s -i -H "Host: demo.local" http://${MINIKUBE_IP}/ | grep "HTTP/"
done
All responses now return clean HTTP/1.1 200 OK status codes. The blast radius was contained, and you can now debug the v2 deployment offline without risking further downtime.
Post-Exercise Review Questions
Take a few minutes to consider these questions after finishing the lab:
- What would have happened if we ran a traditional rolling update instead of a canary deployment with this broken v2 image?
- If our service received only 5 total requests an hour, how would that affect our ability to catch the 500 errors using percentage-based routing?
- How would you adjust this setup to route traffic based on a custom HTTP header (like
X-Developer-Preview: true) instead of a random percentage split?
Frequently Asked Questions
What is canary deployment in DevOps?
Canary deployment is a progressive delivery strategy where a new software release is exposed to a small, controlled percentage of real user traffic alongside the existing stable version. This allows teams to validate performance, error rates, and system behavior under live conditions before committing to a full production rollout.
Why is it called a canary deployment?
The name comes from the historical mining practice of bringing caged canaries into underground coal mines. Because canaries are unusually sensitive to toxic gases like carbon monoxide, any distress from the bird provided an early warning for miners to evacuate. In software, exposing new code to a small group of users acts as that same early warning system.
How much traffic should go to a canary release initially?
Most teams start by routing between 1% and 5% of total traffic to the canary. However, the right number depends on your overall request volume. High-throughput services handling tens of thousands of requests per second often start at 1% or lower to limit exposure, while lower-traffic services may need 10% or more to collect statistically meaningful data.
What is the difference between canary and blue-green deployment?
Blue-green deployment uses two identical, fully provisioned production environments. Once the new version (Green) is verified, 100% of user traffic is flipped over from the old version (Blue) all at once. In contrast, canary deployments run both versions concurrently within the same environment and use traffic routing to shift requests incrementally (e.g., 5%, 25%, 50%, 100%) based on continuous metric evaluation.
Can Kubernetes support canary deployments natively?
Basic Kubernetes Deployment and Service objects can approximate a canary release by varying the ratio of old and new pods (e.g., running 9 stable pods and 1 canary pod to achieve a rough 10% split). However, native Kubernetes cannot perform precise, percentage-based traffic routing without tying traffic allocation directly to your pod counts. To do canary routing properly, you need an ingress controller (like NGINX), a service mesh (like Istio), or a progressive delivery operator (like Argo Rollouts).
Which tools are used for canary deployment?
Common tools include:
- Orchestration: Kubernetes
- Traffic Management: NGINX Ingress Controller, Traefik, Envoy, Istio
- Progressive Delivery: Argo Rollouts, Flagger
- Telemetry & Metrics: Prometheus, Datadog, New Relic
- Visualization: Grafana
- CI/CD Automation: GitHub Actions, Jenkins, GitLab CI
How does automated rollback work?
Automated rollback systems continuously evaluate application metrics (such as HTTP 5xx error rates, response latencies, and container crashes) against predefined thresholds during each rollout step. If a metric breaches an acceptable limit, the progressive delivery controller automatically updates the traffic router to drop canary allocation to 0%, instantly returning all traffic to the stable version.
Is canary deployment suitable for microservices?
Yes, canary deployments are widely used in microservice architectures. Because microservices interact over distributed networks, code changes can introduce unexpected side effects across dependencies that are difficult to replicate in testing. Progressive traffic routing helps teams isolate regressions within individual services before they cascade across the broader system.
Does canary deployment eliminate production risks?
No deployment strategy can eliminate all production risk. While canary releases significantly reduce your blast radius and help catch regressions early, they cannot prevent issues caused by breaking database changes, shared resource bottlenecks, or poorly instrumented metrics. Canary deployments should complement—not replace—automated testing, robust security practices, and comprehensive observability.
Release Changes Gradually, Learn Continuously
Modern software delivery is all about balancing speed with stability. As architectures grow more distributed, the traditional approach of pushing high-risk, all-or-nothing releases to production is increasingly difficult to justify. Canary deployments offer a pragmatic path forward. By running old and new versions side by side, steering small slices of traffic dynamically, and letting real operational data guide promotion decisions, teams can release code with much greater confidence. When unexpected regressions occur—as they inevitably will—the blast radius remains small, your core business stays protected, and rollbacks happen in seconds rather than hours. Implementing an effective canary workflow takes work: you need solid dynamic routing, reliable health probes, automated metric analysis, and careful database planning. But the return on that investment is substantial. By transforming deployments from high-stress events into controlled, measurable experiments, canary releases help engineering teams ship software faster, reduce downtime, and continuously improve their systems.