






Deploying software into production is often one of the most nerve-wracking milestones in the software development lifecycle. For decades, traditional deployments resembled high-wire acts without safety nets: an engineering team logged in at midnight, placed a maintenance banner on the landing page, terminated active services, executed in-place file overwrites or package updates, executed database migrations, and prayed that the health checks turned green before morning rush hour. When a critical bug slipped through or a runtime library failed to link, disaster followed. Rolling back meant executing manual reversal scripts, restoring multi-gigabyte database snapshots, or pushing panic-driven hotfixes under executive pressure. Modern software delivery demands continuous availability. Users expect digital services to remain operational 24/7/365 across global time zones, rendering maintenance windows obsolete. In high-velocity teams—and throughout the community learning practical delivery workflows at DevOpsSchool—the focus has shifted decisively toward automated, predictable release patterns that treat infrastructure as code and deployments as low-stress routines.
Blue-green deployment stands as one of the foundational patterns of modern release engineering. By decoupling application installation from application activation, it gives engineering teams the luxury of pre-release production validation and near-instantaneous recovery. This comprehensive guide provides an in-depth, practical examination of blue-green deployment explained from the ground up: how it works, how traffic routing operates behind the scenes, how to manage stateful data layers, and how to automate the lifecycle inside your CI/CD pipelines.
1. The Deployment Problem Blue-Green Tries to Solve
To appreciate why blue-green deployment is so widely embraced, consider what happens during an in-place or “recreate” deployment.
In an in-place deployment model, application binaries or container images are updated directly on the existing host infrastructure:
[In-Place Deployment Lifecycle]
1. Stop running v1.0 application instances -> [DOWNTIME BEGINS]
2. Download and unpack v2.0 binaries / pull images
3. Overwrite local configuration files
4. Start v2.0 runtime processes
5. Run smoke tests -> [FAILURE DETECTED: Corrupted DLL/Dependency]
6. Attempt recovery: reinstall v1.0, reconfigure, restart -> [EXTENDED DOWNTIME]
This model introduces four critical failure modes:
- Unavoidable Downtime: Because the old application process must yield its ports and memory space to the new process, incoming requests are dropped or rejected during the transition window.
- Environmental Drift and In-Flight Corruption: If an update fails halfway through a fleet of virtual machines, the platform ends up in an inconsistent state where some nodes serve v1.0 while others fail to boot v2.0.
- High Rollback Latency (Mean Time to Recovery): When an operational defect is uncovered after launch, reverting requires re-running the installation sequence backward. Re-downloading old artifacts, re-applying old configurations, and warming up runtime runtimes can take tens of minutes or even hours.
- Validation in the Dark: Teams cannot thoroughly test how the new version behaves under actual production-equivalent network boundaries, environment variables, and security policies without making it accessible to real users.
Blue-green deployment fundamentally eliminates these hazards by shifting the release boundary from an installation action to a routing action.
2. Understanding the Blue-Green Environment Model
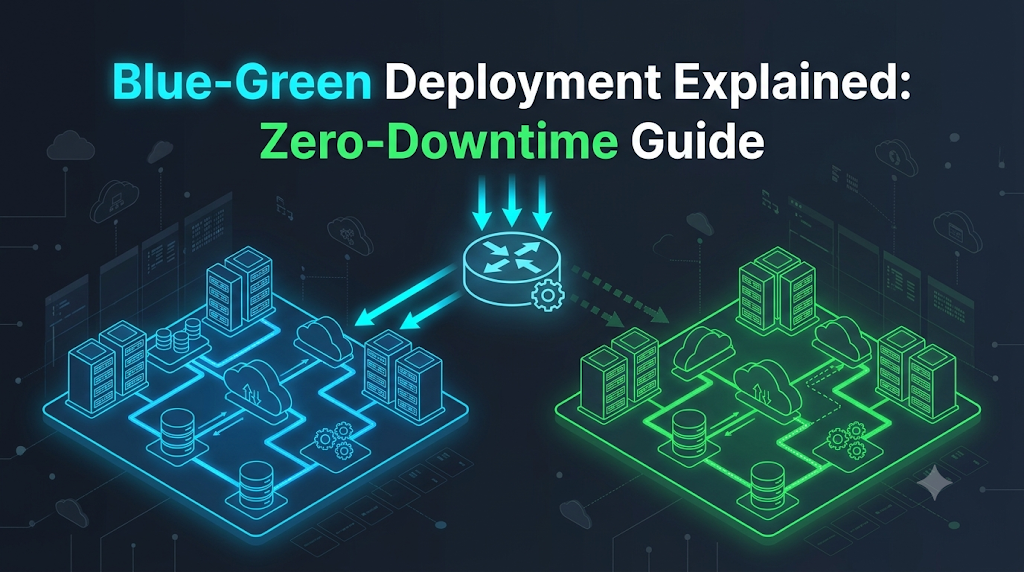
The core philosophy of blue-green deployment is simple yet powerful: maintain two identical, isolated production environments—conventionally designated as Blue and Green. At any given moment, only one environment is public-facing and serving live customer traffic, while the other remains idle or dedicated to pre-release testing.
                            +-------------------+
                            |   End Users /     |
                            |   Client Apps     |
                            +---------+---------+
                                      |
                                      | [Public Traffic]
                                      v
                            +---------+---------+
                            |  Traffic Router / |
                            |   Load Balancer   |
                            +----+---------+----+
                                 |         :
          [Active Production]    |         : [Idle / Smoke Testing]
                                 v         v
             +-----------------------+   +-----------------------+
             |   BLUE Environment    |   |   GREEN Environment   |
             |   App Version: 1.0.0  |   |   App Version: 2.0.0  |
             |   Port: 8080          |   |   Port: 8081          |
             |   State: LIVE         |   |   State: STANDBY      |
             +-----------+-----------+   +-----------+-----------+
                         |                           |
                         +-------------+-------------+
                                       |
                                       v
                         +-------------+-------------+
                         |     Shared Production     |
                         |     Databases & Caches    |
                         +---------------------------+
The Architectural Components
- The Blue Environment: The currently active, live production environment running the stable version of the application (e.g., v1.0.0). All production domains, mobile clients, and external API partners point here.
- The Green Environment: The twin, idle production environment running the release candidate (e.g., v2.0.0). It is structurally identical to Blue in hardware sizing, OS configuration, networking topologies, and security policies, but it receives zero public end-user traffic.
- The Traffic Routing Layer: The gateway positioned upstream of both environments. Depending on the architecture, this can be an Application Load Balancer (ALB), an API Gateway, a Reverse Proxy (such as NGINX or HAProxy), a Kubernetes Ingress Controller, or an internal service mesh.
- The Shared Data Layer: The underlying persistent storage layer—comprising relational databases, NoSQL stores, distributed file systems, and caching tiers—that both Blue and Green interact with.
Because the Green environment is an exact mirror of Blue, it serves as the ultimate staging ground. Engineers can execute integration tests, security vulnerability scans, and end-to-end user journeys against Green while real production transactions continue undisturbed on Blue. Once Green passes every quality gate, the routing layer flips. Green becomes the live production environment, and Blue drops into standby mode.
3. Following a Release From Preparation to Traffic Switching
A successful blue-green deployment is not a single command; it is an orchestrated lifecycle. Following a structured sequence prevents human error and ensures repeatable outcomes.
+------------+     +------------+     +------------+     +------------+
|  1. Target | --> | 2. Deploy  | --> |  3. Smoke  | --> | 4. Route   |
| Assessment |     | Standby    |     |    Test    |     |  Traffic   |
+------------+     +------------+     +------------+     +------------+
                                                                |
+------------+     +------------+     +------------+            |
| 8. Release | <-- | 7. Standby | <-- | 6. Monitor | <----------+
|  Complete  |     | Retention  |     |  Telemetry |
+------------+     +------------+     +------------+
Stage 1: Identify the Active Environment
Before touching any infrastructure, the automation engine or engineer must determine which environment is currently public-facing. If Blue is serving live traffic, Green is the target for deployment. If Green is live, Blue becomes the target. Never rely on manual memory; query the routing layer’s state programmatically.
Stage 2: Prepare the Standby Environment
Ensure the idle environment is clean and ready. If the standby environment was left running older code from two releases ago, flush transient worker queues, ensure log forwarders are active, and verify that the operating system packages and underlying infrastructure comply with current security baselines.
Stage 3: Deploy the New Application Version
Deploy the new build artifacts (container images, binaries, or application bundles) exclusively to the standby environment. During this step, the live environment experiences zero CPU spikes, network throttling, or restart penalties.
Stage 4: Run Health Checks and Internal Smoke Tests
Before exposing the standby environment to any user, verify process integrity:
- Does the application process start cleanly without runtime exceptions?
- Do local
/healthzor/readyHTTP endpoints respond with status code200? - Can the new version successfully open connection pools to database clusters and cache nodes?
Stage 5: Validate Application Behavior via Private Endpoints
Run comprehensive integration test suites against the standby environment. Teams typically accomplish this using private DNS records, internal headers (e.g., X-Target-Env: green), or dedicated internal load balancers:
- Execute automated browser-based end-to-end tests (verifying login flows, checkout workflows, and navigation).
- Execute synthetic API transactions that simulate realistic user requests.
- Validate that third-party integrations (payment gateways, notification services) respond properly in test or sandboxed modes.
Stage 6: Switch Traffic to the New Environment
Once the release candidate satisfies every automated and manual criterion, trigger the traffic switch. The router or load balancer redirects incoming requests from the old environment to the new one.
Stage 7: Monitor the Release (The Critical Observation Window)
Immediately after the switch, closely monitor operational telemetry:
- HTTP 4xx and 5xx error rates
- P95 and P99 response latencies
- Database connection pool exhaustion and query lock contention
- Server CPU and memory consumption
Stage 8: Retain the Previous Environment for Recovery
Resist the urge to tear down or clean up the old environment immediately. Keep it intact, fully configured, and warm for an agreed observation period (e.g., 30 minutes to 24 hours). If a silent, catastrophic bug emerges—such as memory leaks or edge-case crashes—the team can instantly switch traffic back.
4. What Actually Happens When Traffic Changes?
The phrase “switching traffic” sounds effortless, but the underlying mechanics depend heavily on which networking layer handles the transition. Selecting the wrong routing mechanism can cause ghost traffic, dropped sessions, and fragmented user experiences.
The Routing Layer Comparison
| Routing Mechanism | Switch Speed | Caching Susceptibility | Connection Draining Support | Common Use Cases |
| DNS Record Update | Slow (Minutes to Hours) | High (Client/ISP TTL caching) | No native draining | Global multi-region disaster recovery |
| Reverse Proxy (NGINX/HAProxy) | Milliseconds | None | Excellent | On-premises VMs, self-hosted web fleets |
| Cloud Application Load Balancer | Seconds | None | Native target group deregistration | AWS (ALB), Google Cloud (GLB), Azure App Gateway |
| Kubernetes Service Selector | Instantaneous (<1 second) | None | Handled via Pod lifecycle (preStop) | Containerized microservices in Kubernetes clusters |
DNS Switching: The Pitfalls of Client Caching
Early blue-green setups often relied on changing public DNS records (e.g., altering api.company.com from Blue IP 198.51.100.10 to Green IP 198.51.100.20).
While conceptually simple, DNS is inherently unreliable for zero-downtime cutovers:
- Time-to-Live (TTL) Violations: Even if you set your record’s TTL to 60 seconds, recursive DNS resolvers at consumer ISPs, corporate proxies, and mobile operating systems frequently cache DNS records for hours or days.
- Split Traffic Windows: For a prolonged period, some users hit the old version while others hit the new version, making rapid rollbacks impossible.
- Conclusion: Never use DNS as your primary blue-green switching mechanism for transactional web services. Use an upstream reverse proxy or load balancer instead.
Load Balancers, Proxies, and Connection Draining
When an Application Load Balancer or reverse proxy switches traffic, it does not abruptly sever active TCP connections. Instead, it utilizes connection draining (also known as deregistration delay):
- New Request Redirection: The moment the rule updates, all incoming HTTP requests or SYN packets are directed to the Green target group.
- In-Flight Grace Period: Existing connections currently processing on the Blue nodes are allowed to finish their HTTP request/response cycles.
- Graceful Timeout: Once all active requests on Blue conclude—or when a configured timeout (e.g., 60 seconds) expires—the load balancer stops routing traffic to Blue altogether.
This ensures that a user completing a checkout or uploading a file does not experience a connection reset error (TCP RST) during the deployment.
5. A Practical Walkthrough: Releasing a Web Application
To ground these concepts in an operational scenario, let us walk through releasing version 2.0.0 of a Node.js web service running behind an NGINX reverse proxy.
Scenario Context
- Application:
inventory-service - Active Environment (Blue): Listening locally on
127.0.0.1:8080(Running v1.0.0) - Standby Environment (Green): Listening locally on
127.0.0.1:8081(Targeted for v2.0.0) - Ingress Router: NGINX listening on public ports
80/443, proxying upstream traffic.
                        [Client Internet Traffic]
                                   |
                                   v
                         [NGINX Reverse Proxy]
                      (upstream: inventory_service)
                                   |
                    +--------------+--------------+
                    |                             |
                    v                             v
           [127.0.0.1:8080]              [127.0.0.1:8081]
          Blue Target (v1.0.0)          Green Target (v2.0.0)
             [ACTIVE NOW]                  [DEPLOY TARGET]
Step 1: Inspect Current Production Routing
Examine the active NGINX configuration upstream definition:
Nginx
# /etc/nginx/conf.d/inventory.conf

upstream inventory_service {
    # Active: Blue environment
    server 127.0.0.1:8080 max_fails=3 fail_timeout=10s;

    # Standby: Green environment (disabled)
    # server 127.0.0.1:8081;
}

server {
    listen 80;
    server_name inventory.internal.example;

    location / {
        proxy_pass http://inventory_service;
        proxy_set_header Host $host;
        proxy_set_header X-Real-IP $remote_addr;
        proxy_set_header X-Forwarded-For $proxy_add_x_forwarded_for;
    }
}
NGINX is currently directing all incoming requests to port 8080 (Blue).
Step 2: Deploy Version 2.0.0 to Green (Port 8081)
Pull the newest application artifact and start the service exclusively on the standby port:
Bash
# Pull and execute the v2.0.0 artifact on the Green port
docker run -d \
  --name inventory-green-v2 \
  -e PORT=8081 \
  -e DB_HOST=prod-db.internal.example \
  -p 127.0.0.1:8081:8081 \
  registry.internal.example/inventory-service:2.0.0
Step 3: Execute Health Checks and Validation on Green
Before altering NGINX, query the private endpoint on port 8081 to verify application health:
Bash
# 1. Check basic process readiness
curl -I http://127.0.0.1:8081/healthz
# Expected output: HTTP/1.1 200 OK

# 2. Check application version and database connectivity
curl -s http://127.0.0.1:8081/api/v1/system/status | jq .
# Expected output:
# {
#   "status": "healthy",
#   "version": "2.0.0",
#   "db_connection": "connected"
# }

# 3. Execute synthetic smoke tests
curl -X POST http://127.0.0.1:8081/api/v1/cart/validate \
  -H "Content-Type: application/json" \
  -d '{"itemId": "SKU-992", "quantity": 1}'
Every response returns successfully. Version 2.0.0 is operational, yet zero public users have touched it.
Step 4: Perform the Traffic Switch
Update the NGINX upstream definition to direct traffic to port 8081, commenting out port 8080:
Nginx
# /etc/nginx/conf.d/inventory.conf

upstream inventory_service {
    # Standby: Blue environment (kept warm for immediate rollback)
    # server 127.0.0.1:8080;

    # Active: Green environment (v2.0.0)
    server 127.0.0.1:8081 max_fails=3 fail_timeout=10s;
}
Validate the NGINX configuration syntax and trigger a hot reload:
Bash
# Verify configuration syntax
nginx -t

# Trigger graceful reload without dropping connections
nginx -s reload
Because NGINX reloads worker processes without closing listening sockets, the traffic switch completes in milliseconds without a single dropped packet.
Step 5: Post-Release Monitoring
Observe real-time production logs and metrics:
Bash
# Monitor NGINX upstream logs for unexpected errors
tail -f /var/log/nginx/access.log | grep "HTTP/1.1\" 5"
Step 6: Handling a Failure Scenario (Instant Rollback)
Suppose that five minutes after switching, our APM monitoring platform detects a memory leak in 2.0.0 that causes response latency to spike past 3,000ms.
Because we did not shut down Blue (127.0.0.1:8080), rollback is instantaneous. We revert the upstream configuration file:
Nginx
upstream inventory_service {
    server 127.0.0.1:8080;
    # server 127.0.0.1:8081;
}
Reload NGINX again:
Bash
nginx -s reload
In under two seconds, live production traffic is safely back on the proven 1.0.0 code running on Blue. The engineering team can now inspect logs and dump memory profiles on Green at their leisure without disrupting users.
6. Blue-Green Deployment in Cloud and Container Platforms
While the basic networking concept remains constant, different runtime platforms offer distinct mechanisms for implementing blue-green switching.
1. Traditional Virtual Machines and Cloud Load Balancers
In standard AWS, Azure, or Google Cloud environments:
- You maintain two Auto Scaling Groups (ASGs) or Virtual Machine Scale Sets:
asg-blueandasg-green. - An Application Load Balancer routes traffic to target groups.
- The deployment process provisions or updates
asg-green, attaches it to agreen-target-group, verifies instance health, and then modifies the listener rule on the ALB to route 100% of incoming production traffic togreen-target-group.
                    [AWS Application Load Balancer]
                                   |
                  +----------------+----------------+
                  | (Listener Rule: 100% Traffic)   |
                  v                                 v
        [blue-target-group]               [green-target-group]
                  |                                 |
           [asg-blue: v1]                    [asg-green: v2]
2. Docker Swarm / Container Hosts
On standalone Docker engines or Swarm clusters, blue-green deployments are frequently managed using front-end reverse proxies like Traefik or NGINX paired with dynamic container labeling. When the green container container passes health checks, proxy container routing rules are dynamically updated via API calls or shared volume reloads.
3. Kubernetes Services and Ingress Controllers
Kubernetes provides native constructs that make blue-green deployments straightforward using Label Selectors.
In Kubernetes, client pods or ingress controllers communicate with an application via a Service. The Service determines which backend Pods receive traffic using a selector label.
The Blue Deployment Manifest (Active)
YAML
apiVersion: apps/v1
kind: Deployment
metadata:
  name: payment-app-blue
spec:
  replicas: 3
  selector:
    matchLabels:
      app: payment-processor
      version: "v1"
  template:
    metadata:
      labels:
        app: payment-processor
        version: "v1"
    spec:
      containers:
      - name: payment-api
        image: payment-api:1.0.0
        ports:
        - containerPort: 8080
The Green Deployment Manifest (Standby)
YAML
apiVersion: apps/v1
kind: Deployment
metadata:
  name: payment-app-green
spec:
  replicas: 3
  selector:
    matchLabels:
      app: payment-processor
      version: "v2"
  template:
    metadata:
      labels:
        app: payment-processor
        version: "v2"
    spec:
      containers:
      - name: payment-api
        image: payment-api:2.0.0
        ports:
        - containerPort: 8080
The Live Kubernetes Service
YAML
apiVersion: v1
kind: Service
metadata:
  name: payment-service
spec:
  type: ClusterIP
  ports:
  - port: 80
    targetPort: 8080
  selector:
    app: payment-processor
    version: "v1" # Pointing directly to Blue
The Kubernetes Traffic Switch
To execute the cutover, patch the Service’s selector to target version: "v2":
Bash
kubectl patch service payment-service -p '{"spec":{"selector":{"version":"v2"}}}'
Within a fraction of a second, the Kubernetes Endpoint controller updates the routing endpoints in kube-proxy or the Ingress controller. All new service requests immediately resolve to the Green pods. If a rollback is needed, simply re-patch the selector back to version: "v1".
7. Rollback: Returning to the Previous Version
Rollback speed is the defining superpower of blue-green deployment.
In traditional in-place or rolling releases, a rollback is an active remediation. You must re-deploy the old version across every server, which takes just as long as the initial failed deployment. If servers are crashing or disk I/O is saturated, rollbacks can stall, prolonging outages.
In blue-green deployment, a rollback is merely an inverted traffic switch:
[Normal Flow]   Router ----> [GREEN: Live v2.0]
                             [BLUE:  Standby v1.0]

[Instant Flip]  Router ----> [BLUE:  Live v1.0]  <-- Restored in seconds!
                             [GREEN: Defective v2.0 (Isolated for analysis)]
The Triage Advantage
When traffic is reverted to Blue, Green remains untouched. It is not destroyed, overwritten, or rebooted. This provides engineers with an intact “crime scene.”
Engineers can attach debuggers, extract runtime core dumps, inspect deadlocked threads, and query error logs without the fear of compounding an ongoing customer outage.
The Limitations of Rollback
Despite its elegance, teams must recognize what a blue-green traffic flip cannot undo:
- Database Mutations: If version
2.0.0ran for ten minutes and wrote 500 records into a shared database with corrupted foreign keys, switching traffic back to1.0.0will not fix the corrupted records. - Third-Party External Side Effects: If
2.0.0sent 2,000 erroneous emails, dispatched erroneous webhooks, or charged credit cards via Stripe, flipping the router back to Blue does not undo those third-party API calls. - In-Flight Data Loss: Any user sessions or cart states stored strictly in the local memory of Green servers will be lost when users are redirected back to Blue.
Understanding these limitations brings us to the most complex aspect of the pattern: state management.
8. The Difficult Part: Databases, Sessions, and Shared Resources
If all applications were stateless, every engineering organization would run blue-green deployments exclusively. The true complexity arises when applications read and write persistent state.
Because both the Blue and Green environments must generally connect to the same underlying production database during the cutover window, the database schema must simultaneously support both versions of the application code.
       [Blue App: v1.0]                     [Green App: v2.0]
    (Expects "name" column)             (Expects "first_name" & "last_name")
               \                                   /
                \                                 /
                 v                               v
             +---------------------------------------+
             |       Shared Relational Database      |
             |       [Must support BOTH schemas]     |
             +---------------------------------------+
1. Database Schema Evolution: The Expand and Contract Pattern
You cannot execute destructive database changes (such as renaming or dropping columns) right before a blue-green switch, because doing so instantly breaks the currently live Blue environment.
To safely evolve schemas across blue-green releases, engineering teams utilize the Expand and Contract Pattern (also called the Parallel Run or Tolerant Reader pattern):
PHASE 1: EXPAND (Additive Migration)
-----------------------------------------------------------
Add new columns alongside the old ones.
Both Blue (v1.0) and Green (v2.0) can query the database.
- Schema has: "name", "first_name", "last_name"
- Blue reads/writes "name".
- Green reads/writes "first_name" and "last_name".
- Database triggers or app code synchronize old and new columns.

PHASE 2: TRAFFIC CUTOVER
-----------------------------------------------------------
Switch routing from Blue to Green.
- Green is now live; users interact with "first_name" and "last_name".
- If a rollback occurs, Blue can still function because "name" is intact.

PHASE 3: CONTRACT (Destructive Cleanup)
-----------------------------------------------------------
Days or weeks later, once v2.0 is proven completely stable:
- Execute a cleanup migration to drop the old "name" column.
By decoupling database migrations into non-breaking, additive phases, you guarantee that switching traffic back and forth never causes SQL syntax errors or missing column exceptions.
2. User Session Management
If user sessions are stored locally in server memory (e.g., in Node.js heap memory or Apache sessions), users will be abruptly logged out when traffic switches from Blue to Green.
- The Solution: Centralize session state. Store authentication tokens, shopping carts, and active sessions in an external, distributed in-memory data store like Redis or Memcached. Both Blue and Green must share this session cluster. Ensure session serialization formats are backward- and forward-compatible.
3. Background Jobs, Cron Tasks, and Worker Queues
If both Blue and Green are running simultaneously, who executes asynchronous background jobs?
- If both environments run background workers subscribed to the same RabbitMQ queue or Kafka topic, Green workers might consume messages before Green is officially live, processing business logic with new code prematurely.
- The Solution: Keep background workers and schedulers in the standby environment disabled or paused during testing. Only enable workers on the new environment simultaneously with—or immediately following—the traffic cutover.
4. Configuration and Environment Secrets
Blue and Green require distinct instance-specific identities (such as logging tags indicating env: green vs env: blue), yet they must share identical secret keys for production database access, encryption keys, and third-party APIs. Manage these configurations through environment variables injected via secrets managers (such as HashiCorp Vault, AWS Secrets Manager, or Kubernetes Secrets) rather than hardcoding them into application code.
9. Where Blue-Green Deployment Fits—and Where It Does Not
No architectural pattern is a silver bullet. Choosing blue-green deployment requires balancing business risk against infrastructure cost and operational overhead.
When Blue-Green Is the Ideal Choice
- Customer-Facing E-Commerce and Web Applications: Where a few minutes of checkout downtime directly translates to measurable revenue loss.
- Mission-Critical Public APIs: Where external partners and mobile clients expect uninterrupted connectivity without scheduled maintenance windows.
- Releases with High Uncertainty: When releasing complex business logic where the ability to execute a zero-second rollback dramatically lowers operational stress.
- Environments with Automated Infrastructure: Cloud environments where provisioning duplicate infrastructure on-demand via Terraform or CloudFormation is programmatic and quick.
When Blue-Green May Not Be Suitable
- Massive, Cost-Prohibitive Monoliths: If your production system requires 50 high-memory bare-metal servers, maintaining a permanent duplicate fleet doubles your hardware expenditures, which can be budget-prohibitive.
- Heavy Stateful Workloads with Complex Embedded Data: Applications with local, disk-bound storage (such as large Elasticsearch clusters or self-hosted legacy databases) cannot be casually duplicated or switched via simple proxy reloads.
- Destructive, Non-Backward-Compatible Database Migrations: When an application requires a complete, non-reversible restructuring of its data storage format that cannot be adapted using the Expand-and-Contract model.
- Hardware-Constrained Edge or IoT Devices: Deploying new software to telematics units or localized gateways with strict storage constraints where running parallel versions side-by-side is physically impossible.
10. Blue-Green vs Other Deployment Strategies
To understand where blue-green fits in the broader release engineering landscape, compare it with three other common release strategies: Rolling, Canary, and Recreate.
[Blue-Green]   All traffic switches from Blue to Green simultaneously.
               (100% v1 -> 100% v2)

[Canary]       Traffic is incrementally shifted in percentage slices.
               (95% v1 / 5% v2 -> 75%/25% -> 0%/100%)

[Rolling]      Instances updated one by one within the same pool.
               (Node 1: v2, Node 2: v1, Node 3: v1)

[Recreate]     Instances terminated all at once, then new version boots.
               (100% v1 -> 0% live [DOWNTIME] -> 100% v2)
Strategy Comparison Matrix
| Deployment Strategy | Resource Cost | Rollback Speed | Downtime Risk | User Exposure Risk | Implementation Complexity |
| Blue-Green | High (Requires 2x peak capacity during deployment) | Near-Instantaneous (Router flip) | Zero | All-or-Nothing (100% of users immediately see the new version) | Medium (Requires traffic routing layer and schema discipline) |
| Rolling | Low (Operates within existing server capacity) | Slow (Must roll update backward across nodes) | Zero | Mixed (Users hit different versions concurrently) | Low to Medium (Native to Kubernetes and ECS) |
| Canary | Low to Medium (Small additional baseline capacity) | Fast (Route traffic away from canary nodes) | Zero | Lowest (Only 1–5% of users exposed initially) | High (Requires advanced metric analysis and routing logic) |
| Recreate | Lowest (No extra instances needed) | Very Slow (Must reinstall old version) | High (Guaranteed outage during swap) | None until complete | Lowest (Stop, update, start) |
Complementary Approaches
Blue-green and other deployment strategies are not mutually exclusive. High-performing engineering organizations frequently combine them:
- Blue-Green + Feature Flags: Deploying code via blue-green handles the infrastructure and runtime delivery safely. Once Green is live, new user-facing features remain hidden behind dynamic feature toggles, allowing product managers to release features to target user cohorts safely.
- Blue-Green + Canary: Using an advanced load balancer or service mesh (like Istio), an organization can route 5% of production traffic to the Green environment for an hour. If error budgets remain intact, the balancer routes the remaining 95% to Green in a single operation.
11. Common Implementation Mistakes
Even seasoned operations teams stumble when rolling out blue-green architectures. Here are the most prevalent traps and how to avoid them.
1. Premature Traffic Switching
- The Mistake: Flipping the routing layer before automated smoke tests finish executing, or relying solely on a simple TCP check that passes even when the app returns HTTP 500 errors.
- The Remedy: Implement strict, tiered readiness probes. Require that synthetic health checks verify database query capability, cache access, and key dependencies before the switch command can run.
2. Configuration and Environment Drift
- The Mistake: Blue and Green slowly diverge over time. For example, an engineer hotfixes an OS patch or environment variable on Blue, but neglects Green. When Green becomes live three months later, the application crashes.
- The Remedy: Treat both environments as Immutable Infrastructure. Never modify servers manually. Use tools like Terraform and Ansible to provision Blue and Green from identical, version-controlled definitions.
3. Tearing Down the Standby Environment Too Quickly
- The Mistake: Destroying or updating the old Blue environment immediately after Green goes live to save infrastructure costs.
- The Remedy: Establish a mandatory retention policy. Keep the old environment warm for at least 1 to 4 hours post-release. If a subtle deadlock or memory leak appears under heavy production load, you retain the ability to flip back instantly.
4. Forgetting Session and Cache Serialization
- The Mistake: Version 2.0 on Green serializes user session objects into Redis using a new JSON or Protobuf schema that Version 1.0 on Blue cannot parse. If you must roll back to Blue, all user sessions crash with deserialization errors.
- The Remedy: Ensure that cache keys and session formats are versioned or backward-compatible so that both versions can read and write without throwing uncaught exceptions.
5. Assuming Traffic Switching Fixes Faulty Data
- The Mistake: Believing that because a rollback is fast, bad code cannot harm your business.
- The Remedy: Remember that rollback only reverts code execution, not transactional side effects. If new code charges credit cards or writes corrupt rows to your database, you still face manual data cleanup. Rigorous testing on Green before traffic switching is irreplaceable.
12. Automating Blue-Green Releases Through CI/CD
Manual deployments are error-prone. In an enterprise pipeline, every step of the blue-green lifecycle should be driven by an automated continuous delivery engine such as Jenkins, GitHub Actions, GitLab CI, or ArgoCD.
Team Roles Across the Release Lifecycle
- Developers: Deliver tested code, write backward-compatible database migrations, and supply health-check endpoints.
- DevOps / Cloud Engineers: Maintain the routing fabric, build deployment pipeline templates, and enforce environment parity as code.
- QA Engineers: Author synthetic smoke tests and automated API journeys executed against the standby environment prior to cutover.
- Release Managers / Tech Leads: Oversee pipeline execution and approve production cutover gates when manual governance is required.
A Modern CI/CD Pipeline Workflow
Here is an architectural breakdown of an automated blue-green pipeline implemented in a continuous deployment system:
[Commit / PR Merge]
        |
        v
[1. Build & Test] -----------> Unit Tests, Static Code Analysis, Docker Build
        |
        v
[2. Identify Target] --------> Query Load Balancer (Is Blue active? -> Target Green)
        |
        v
[3. Deploy Artifact] --------> Provision/Deploy v2.0 onto Target Environment
        |
        v
[4. Run Smoke Tests] --------> Execute Automated Integration Tests on Standby
        |
        +---- Failure? ------> Abort Pipeline; Standby destroyed; Live untouched.
        |
        v
[5. Manual/Metric Gate] -----> (Optional) Verification Gate / Error-budget check
        |
        v
[6. Switch Traffic] ---------> Update Load Balancer / Ingress to new version
        |
        v
[7. Automated Telemetry] ----> Monitor Error Rates for 15 minutes
        |
        +---- Anomaly? ------> AUTOMATIC ROLLBACK: Flip Router back to original
        |
        v
[8. Decommission Old] -------> Drain connections; power down or idle old environment
Practical Checklists and Failure Scenarios
To help your team implement this pattern reliably, use these checklists and operational templates during release cycles.
Pre-Release Readiness Checklist
- Active/Standby Status Verified: Automation has explicitly verified which environment is currently receiving public traffic.
- Schema Compatibility Confirmed: Database migrations are additive only (Expand phase) and do not break the currently running version.
- Centralized State Validated: User sessions and caches reside in external clusters (e.g., Redis) accessible by both environments.
- Background Workers Paused: Workers in the standby environment are temporarily disabled to prevent premature queue consumption.
- Target Health Checks Green: Standby application instances return HTTP 200 on internal health endpoints.
- Smoke Tests Passed: Automated integration and smoke tests executed against the standby environment pass with 100% success.
Post-Release Monitoring Checklist
- HTTP Edge Status Codes: Error rates (4xx, 5xx) on the load balancer remain within acceptable Service Level Objectives (SLOs).
- P99 Latency Metrics: Response times match or improve upon the previous version’s baseline.
- Database Connection Health: Database connection pools on the new version are stable, with no deadlocks or query spikes.
- Worker Services Active: Background workers in the new environment have been activated and are consuming jobs smoothly.
- Standby Preserved: The old environment remains running and warm in standby mode until the observation window closes.
Rollback Decision Checklist
Initiate an immediate rollback to the standby environment if any of the following occur within the observation window:
- Critical business transactions (e.g., checkout, login, data creation) fail smoke tests or user journeys.
- HTTP 5xx error rates exceed 0.5% of total volume for more than two consecutive minutes.
- Application response latency increases by more than 50% over the pre-release baseline.
- Unhandled exceptions or memory leaks trigger crash-loop restarts in the active application fleet.
Walkthrough: Failure Scenario and Rapid Recovery
The Incident
At 14:00, the engineering team executes a blue-green cutover from Blue (v1.4.0) to Green (v1.5.0) for a high-traffic inventory management system. Smoke tests pass. At 14:05, traffic is 100% switched to Green.
At 14:08, customer support reports that users trying to update inventory with non-ASCII characters (e.g., accent marks or Japanese script) are receiving “500 Internal Server Error” responses. A character-encoding bug in a database query library in v1.5.0 is crashing application worker threads.
The Recovery Execution
- Decision (14:09): The release engineer identifies an unacceptable error rate spike (HTTP 500 rate jumps to 4.2%). A rollback is declared immediately.
- Traffic Reversal (14:10): The engineer triggers the rollback command in the CI/CD pipeline (or executes
nginx -s reload/ patches the Kubernetes service). The load balancer instantly points all incoming connections back to Blue (v1.4.0), which has remained warm and untouched. - Recovery Validation (14:11): Error rates return to 0.01%. Non-ASCII update requests process successfully on the v1.4.0 codebase. Total customer disruption: under two minutes.
- Root-Cause Analysis (14:30): The Green environment remains running in its broken state behind an internal testing port. Developers connect to Green, reproduce the character-encoding bug, dump the application stack trace, and write a failing regression test. Once patched and tested, the release pipeline is re-run from the beginning.
Frequently Asked Questions (FAQs)
What is blue-green deployment in DevOps?
Blue-green deployment is a release management strategy that utilizes two identical production environments: one active environment (Blue) that serves real user traffic, and one standby environment (Green) where new application updates are installed and tested. Once validated, traffic is switched to the new environment, minimizing downtime and deployment risk.
How does blue-green deployment reduce downtime?
In traditional deployments, applications experience downtime while old processes are stopped and new files or containers are deployed on the same servers. Blue-green deployment eliminates this downtime because the new application version is fully installed, initialized, and verified on idle infrastructure before traffic is switched. The actual cutover is performed via a load balancer or proxy in seconds or milliseconds.
What is the difference between blue and green environments?
Architecturally and structurally, there is no difference—both are production-grade environments configured with identical network rules, hardware sizing, and security policies. The only difference is operational: at any given moment, one environment is designated as active (serving public users) while the other is idle or reserved for pre-release validation.
How does rollback work in blue-green deployment?
Rollback is accomplished by reversing the traffic switch at the routing layer (load balancer, reverse proxy, or ingress controller). Because the previous, stable application environment is kept warm and running after the release, rolling back does not require reinstalling or rebuilding anything; the router simply directs user traffic back to the old environment in seconds.
Is blue-green deployment possible in Kubernetes?
Yes. Kubernetes supports blue-green deployments natively. Teams can run two independent Deployments (e.g., app-blue and app-green) and manage traffic switching simply by updating the selector field of an upstream Kubernetes Service. It can also be managed using service meshes like Istio or progressive delivery controllers like Argo Rollouts.
Does blue-green deployment require two full production environments?
Yes, at least temporarily during the deployment window. You must have enough infrastructure capacity to run both the current and new versions side-by-side. In cloud and container environments, this capacity can be spun up on-demand right before testing and terminated shortly after a successful release, reducing the cost of running permanent duplicate hardware.
How are database changes handled during blue-green releases?
Because both the active and standby environments typically share the same production database, database schema changes must be backward- and forward-compatible. Teams use the Expand and Contract Pattern, applying additive, non-breaking migrations (such as adding nullable columns) before the code release, and waiting until the release is proven stable before removing old columns or tables.
What is the difference between blue-green and canary deployment?
In a blue-green deployment, 100% of production traffic is switched from the old environment to the new environment at once after validation. In a canary deployment, traffic is shifted incrementally (e.g., 2%, 10%, 25%, 50%, 100%) to a small subset of servers, allowing teams to observe the behavior of the new release against a small fraction of real users before completing the rollout.
Safer Releases Through Controlled Traffic Switching
Deploying software does not have to be a high-stress, late-night ordeal. By decoupling the physical deployment of code from the activation of user traffic, blue-green deployment transforms software releases into predictable, low-risk operational events. The real beauty of the pattern lies in its discipline. It forces organizations to embrace immutable infrastructure, maintain rigorous parity across environments, write clean and backward-compatible database migrations, and decouple state from application runtimes. With near-instantaneous traffic switching and the safety net of an immediate rollback, engineering teams can release updates with confidence. Whether you manage container clusters in Kubernetes, cloud virtual machines behind load balancers, or simple web servers running reverse proxies, the principles remain identical: prepare the standby environment, validate it thoroughly under real-world conditions, switch traffic smoothly, and keep your recovery path open. For professionals advancing their engineering practices at DevOpsSchool and across the wider industry, mastering blue-green releases is a critical step toward achieving true zero-downtime continuous delivery.