


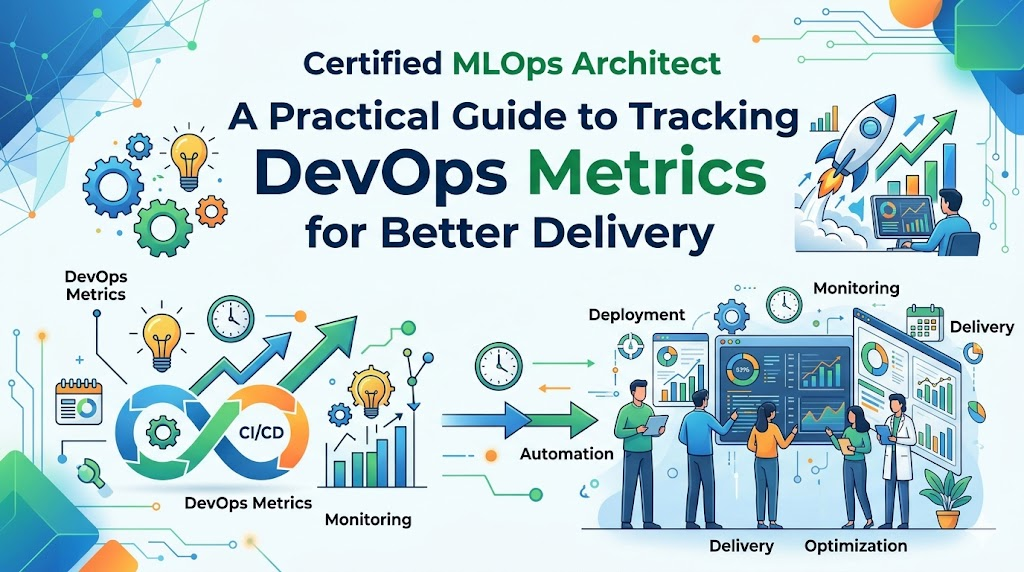
Introduction
In the world of modern software engineering, there is a fundamental truth: you cannot improve what you do not measure. Many teams start their DevOps journey with high hopes, automating their pipelines and moving to the cloud, only to find themselves wondering if they are actually moving faster or just working harder. Without a clear set of benchmarks, engineering progress remains a mystery.
DevOps success is not about implementing the latest tools; it is about measurable outcomes. By tracking the right data, teams can identify bottlenecks, improve software reliability, and create a culture of continuous learning. When you shift from guessing to observing, you empower your team to make decisions based on reality rather than intuition. This guide is designed to help you navigate the landscape of data-driven delivery, providing a roadmap for those looking to mature their processes through DevOpsSchool. Let us look at how you can leverage metrics to foster a more productive and stable environment.
What Are DevOps Metrics?
At their core, DevOps metrics are quantitative measures used to track the efficiency, stability, and quality of your software delivery process. Think of them like a fitness tracker for your engineering team. Just as a runner monitors their pace, heart rate, and distance to improve their performance, a DevOps team uses metrics to understand how code moves from a developer’s laptop to the production environment.
These metrics provide a objective view of your workflow. They move the conversation away from opinions—such as “I feel like we are deploying too slowly”—to hard facts: “Our lead time for changes is currently six days, and we want to reduce it to three.”
Why DevOps Metrics Matter
Tracking performance provides the visibility necessary to transform a chaotic release cycle into a predictable, high-performing pipeline. Here is why they are essential:
- Visibility into Performance: You gain a clear map of your software development lifecycle.
- Faster Problem Detection: Metrics act as early warning signs when something is drifting off course.
- Better Decision-Making: Leadership can prioritize technical debt or feature work based on actual bottlenecks.
- Continuous Improvement: Data provides the feedback loop required to refine your processes over time.
For example, if your team notices that the build success rate is consistently low on Fridays, you have identified a specific pattern. You can then investigate whether this is due to late-in-the-week code merges or reduced peer-review bandwidth, allowing you to fix the root cause rather than reacting to the symptom.
The Most Important DevOps Metrics Every Team Should Track
While there are dozens of data points you could monitor, starting with the most impactful ones prevents analysis paralysis.
| Metric | Why It Matters |
| Deployment Frequency | Measures how often you successfully release code to production. |
| Lead Time for Changes | Measures the speed from code commit to production deployment. |
| Change Failure Rate | Identifies the percentage of deployments that result in failure. |
| Mean Time to Recovery (MTTR) | Tracks how quickly you restore service after an incident. |
Understanding DORA Metrics
The DevOps Research and Assessment (DORA) group identified the four metrics listed above as the “gold standard” for measuring DevOps success. These are not just arbitrary numbers; they are proven indicators that correlate directly with both software delivery performance and organizational stability. By focusing on these four, teams avoid the noise of vanity metrics and concentrate on what truly impacts the business.
Deployment Frequency
This measures how often your team pushes code to production. High-performing teams deploy multiple times a day. If your team only deploys once a month, you are likely accumulating significant risk. Frequent, smaller deployments are inherently easier to troubleshoot than massive, monolithic releases.
Lead Time for Changes
This counts the time it takes for a commit to get to production. If a developer finishes a feature on Monday, but it does not reach the customer until the following Monday, your lead time is a full week. Reducing this gap is the best way to get value into the hands of your users faster.
Change Failure Rate
Even with great automation, things will break. This metric tracks how often a deployment causes a degradation in service. A high failure rate often suggests that your testing phase—or your automated CI/CD checks—needs more rigor.
Mean Time to Recovery (MTTR)
When a failure happens, how long does it take to get back to a “green” state? A low MTTR indicates that your team has excellent observability and incident response processes. It is not about avoiding failure entirely, but about being resilient when it happens.
Additional DevOps Metrics Teams Should Monitor
Beyond the DORA framework, secondary metrics provide deeper technical context.
| Metric | Purpose |
| System Uptime | Ensuring services are available for end-users. |
| Incident Response Time | Tracking how fast the on-call team acknowledges an alert. |
| Build Success Rate | Measuring the reliability of your CI pipeline. |
| Test Pass Rate | Ensuring your automated test suite is providing value. |
| Security Vulnerabilities | Identifying risks before they reach production. |
Monitoring and Observability Metrics
While KPIs track the process, monitoring and observability track the health of your systems.
- Logs: The raw record of events in your application.
- Metrics: Numerical data points over time (e.g., CPU usage, memory consumption).
- Alerts: Proactive notifications triggered when thresholds are breached.
Example: If your CPU usage consistently spikes to 95% every time a specific service is called, you have a clear indicator of a performance bottleneck that needs optimization.
Real-World Example: Team Without Metrics
Imagine a team that does not track performance. They experience frequent production outages, but they have no idea why. They blame the developers for “bad code” or the testers for “missing bugs.” Because they rely on guesswork, they implement random fixes—more meetings, longer approval processes—which actually make their delivery slower and their morale lower.
Real-World Example: Team Using Metrics Effectively
Now, consider a team that monitors the Change Failure Rate. They realize that 30% of their failures occur in a specific microservice. They pivot to focus on improving the unit tests for that service. Within a month, their failure rate drops to 5%, and their lead time for changes improves significantly because they spend less time on emergency hotfixes.
Common Mistakes Teams Make While Tracking Metrics
- Tracking too many numbers: You end up with a “dashboard forest” that no one looks at.
- Using metrics for blame: If you punish teams for a high MTTR, they will hide their failures.
- Ignoring business goals: Ensure your metrics align with what the company is trying to achieve.
- Focusing only on speed: Velocity without quality leads to technical debt.
Best Practices for Using DevOps Metrics
- [ ] Track a limited number of high-impact metrics.
- [ ] Use data solely for process improvement, not for performance reviews.
- [ ] Review trends in regular team retrospectives.
- [ ] Balance speed (deployment frequency) with reliability (MTTR).
- [ ] Encourage transparency across the entire organization.
Role of Automation in DevOps Metrics Tracking
You cannot manually track these metrics in a spreadsheet and hope to succeed. Automation is key. Modern CI/CD tools, such as Jenkins, GitLab, or GitHub Actions, have built-in integrations that can push deployment data directly to visualization dashboards. By automating the collection, you ensure the data is accurate and available in real-time.
Role of DevOpsSchool in Learning DevOps Monitoring and Metrics
At DevOpsSchool, the philosophy is rooted in hands-on learning. We believe that understanding metrics is not a theoretical exercise; it is a skill developed by building and monitoring actual CI/CD pipelines. Our programs provide the practical exposure needed to understand how to configure monitoring tools and interpret the resulting data, bridging the gap between classroom theory and real-world engineering workflows.
Career Importance of Understanding DevOps Metrics
Whether you are a DevOps Engineer, SRE, or Cloud Engineer, your value in the job market is tied to your ability to improve outcomes. Managers are no longer looking for people who can just “set up a server.” They are looking for engineers who can look at a dashboard, identify a bottleneck in the deployment pipeline, and propose an architectural change to fix it. Understanding metrics is a key differentiator for career growth.
Industries Using DevOps Metrics
- SaaS Companies: To ensure 24/7 availability for subscribers.
- Banking & Finance: To balance rapid feature delivery with strict regulatory security.
- Healthcare: To prioritize high reliability and data integrity.
- E-Commerce: To maintain performance during high-traffic sales events.
- Telecom: To manage massive-scale infrastructure complexity.
Future of DevOps Metrics
The future lies in Predictive Monitoring. Instead of just reacting to failures, AI-powered systems will soon identify patterns that suggest a failure might happen, allowing engineers to intervene before a service goes down. As tools get smarter, our focus will shift from “how long did it take to recover” to “how we prevented the issue entirely.”
FAQs
- What are DevOps metrics? These are measurements that track the efficiency and quality of your software delivery process.
- What are DORA metrics? A set of four research-backed metrics that measure software delivery performance.
- Why is MTTR important? It reflects how quickly your team can recover from inevitable failures.
- How often should metrics be reviewed? Ideally, during team retrospectives or at least once every two weeks.
- Can small teams use DevOps metrics? Yes, even a two-person team benefits from knowing how fast they are delivering.
- Are metrics hard to understand? No, they are simple indicators of your pipeline’s health.
- Do metrics improve performance? They don’t improve it on their own, but they show you where to improve.
- What tools help measure DevOps performance? Tools like Prometheus, Grafana, ELK Stack, and CI/CD native dashboards.
- Should I track everything? No, focus on the DORA metrics first to avoid data overload.
- How do I start? Pick one metric (like Deployment Frequency) and track it for a month.
- Can metrics be used against me? Only if your organization uses them for blame. Use them as a learning tool instead.
- Is it better to have high speed or high stability? You need a balance of both; that is the core of DevOps.
- Do these apply to non-cloud environments? Yes, the principles of measuring flow apply to any IT infrastructure.
- How does DevOpsSchool help? We provide hands-on training to implement these tracking systems in real scenarios.
- What is the most important metric? Usually, it is Lead Time for Changes, as it reflects overall pipeline efficiency.
Final Thoughts
Metrics are not about surveillance; they are about empowerment. When a team embraces a data-driven mindset, they stop fearing failures and start treating them as opportunities to learn. By focusing on the DORA metrics and building a culture that values improvement over blame, you will find that your deployments become faster, your services become more reliable, and your team becomes more confident. Remember, progress is a journey of small, measurable steps. Start today by observing your current state, and the path to improvement will become clear.