




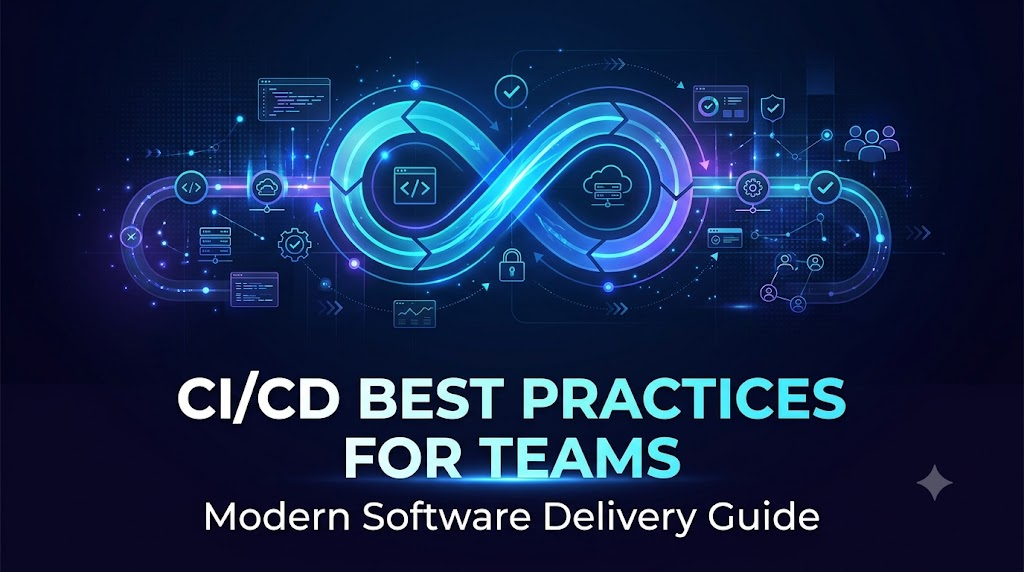
Software organizations face a persistent operational challenge: releasing product updates, bug fixes, and critical patches rapidly to users without compromising application stability, system performance, or security compliance. Historically, engineering teams operated within siloed structures where developers wrote source code, quality assurance (QA) testers performed extensive manual validation late in the development cycle, and system administrators manually scheduled risky off-hours deployment scripts. This segmented handoff model frequently introduced delayed feedback cycles, integration drift, configuration inconsistencies, and high change failure rates. Continuous Integration and Continuous Delivery (CI/CD) resolves these operational bottlenecks by converting manual handoffs into predictable, automated, and observable software workflows. By automatically compiling code, running validation tests, enforcing security policies, and standardizing deployments across staging and production targets, CI/CD establishes a reliable feedback loop for engineering organizations. Educational platforms such as DevOpsSchool illustrate that building an enterprise delivery capability extends far beyond configuring a single automation tool; it requires shared engineering standards, automated testing discipline, rigorous pipeline governance, and deep cross-functional collaboration between development, QA, platform, and operations teams.
When implemented with deliberate team practices, a modern CI/CD pipeline serves as the primary communication engine across engineering, enabling teams to ship resilient code with high confidence.
Establish a Shared Understanding of CI/CD Across the Organization
Before engineering teams can implement effective delivery pipelines, cross-functional stakeholders must establish alignment on the terminology, operational boundaries, and collaborative responsibilities that define modern release engineering.
+-------------------------------------------------------------------------------------------------+
|                                 Continuous Integration (CI)                                     |
|  [Code Commit] ---> [Automated Build] ---> [Unit/Static Tests] ---> [Immutable Artifact Stored] |
+-------------------------------------------------------------------------------------------------+
                                                |
                                                v
+-------------------------------------------------------------------------------------------------+
|                                  Continuous Delivery (CD)                                       |
|  [Deploy to Test/Staging] ---> [Integration/E2E Tests] ---> [Manual/Policy Production Approval]  |
+-------------------------------------------------------------------------------------------------+
                                                |
                                                v (Fully Automated Path)
+-------------------------------------------------------------------------------------------------+
|                                 Continuous Deployment (CD)                                      |
|  [Automated Production Deployment] ---> [Canary / Blue-Green] ---> [Automated Observability]   |
+-------------------------------------------------------------------------------------------------+
The Core Terminology
- Continuous Integration (CI): The software engineering discipline where developers regularly merge their code contributions into a shared central repository (ideally several times per day). Each commit triggers an automated build and test sequence that validates the changes against the existing codebase, detecting syntax errors, compilation bugs, and regressions immediately.
- Continuous Delivery (CD): An extension of Continuous Integration where the software build is automatically packaged, tested across multiple integration layers, and deployed to non-production environments (such as integration, QA, and staging). In Continuous Delivery, every passing build represents a deployable release candidate; however, the final promotion into the live production environment requires an explicit manual decision, automated business approval gate, or maintenance window schedule.
- Continuous Deployment (CD): A fully automated operational workflow where every code change that successfully passes the comprehensive test suites, compliance policies, and security gates across the entire pipeline automatically deploys directly to production environments without human intervention.
- Automated Build and Testing: The execution of standardized scripts within controlled pipeline runners that compile source code, resolve required library dependencies, generate binary packages, and run programmatic unit, integration, and security test suites.
- Deployment Automation: The execution of programmatic scripts, declarative manifests, or orchestrator commands that provision or update infrastructure and application runtimes across target environments reliably without manual human interaction.
- Release Management: The strategic coordination, governance, versioning, verification, and audit tracking that governs how new capabilities and architectural adjustments reach end users.
Continuous Delivery vs. Continuous Deployment
While both methodologies share identical foundations in Continuous Integration and environmental automation, they diverge at the production release gate:
| Dimension | Continuous Delivery | Continuous Deployment |
|---|---|---|
| Production Gate | Manual trigger, scheduled window, or business sign-off | Fully automated immediately upon passing all pipeline stages |
| Organizational Risk Profile | Standard for regulated, compliance-heavy, enterprise, or legacy systems | Optimal for microservices, cloud-native apps, and mature teams |
| Automated Testing Maturity Required | High (must validate integration and regression thoroughly) | Extremely High (must include automated rollback and telemetry) |
| Team Oversight | Product managers and release leads approve final release | Operations and developers rely on progressive delivery and alerts |
Cross-Functional Team Roles in CI/CD
A reliable pipeline is not owned solely by a dedicated DevOps team. Instead, it functions as a shared contract between functional disciplines:
- Software Developers: Write clean, modular, maintainable code; author corresponding unit and early integration tests; resolve pipeline failures immediately when local changes break the integration branch.
- QA and Automation Engineers: Design end-to-end (E2E), integration, functional, and performance test suites; maintain reliable test datasets; establish clear failure thresholds for automated stage advancement.
- DevOps and Platform Engineers: Design, standardize, and maintain the underlying pipeline infrastructure, reusable execution runners, dynamic agent provisioning, deployment orchestrators, and pipeline template libraries.
- Site Reliability and Operations Teams (SRE): Define deployment patterns (canary, blue-green), manage environment infrastructure configurations through declarative code, configure production observability dashboards, and establish automated rollback thresholds.
Standardize Version Control and Branching Practices
Version control forms the foundational bedrock of all CI/CD workflows. If a team’s source control management is unstructured, chaotic, or burdened with long-lived branches, the downstream automation will inherently fail to resolve integration bottlenecks.
Git Hygiene and Commit Standards
Engineering teams must adopt disciplined commit standards. Every commit should represent an atomic, logical change accompanied by an informative commit message. Adopting conventions such as Conventional Commits provides automated pipeline tools with structural context:
Plaintext
feat(auth): implement oauth2 token refresh handler
fix(cart): prevent race condition during inventory deduction
test(billing): add edge case tests for prorated subscription upgrades
chore(deps): update base alpine container image to 3.20
Using clear commit conventions allows automated pipelines to generate semantic version tags, assemble accurate changelogs, and trigger conditional stages (such as executing specific tests only when targeted subsystems change).
Pull Requests, Code Reviews, and Protected Branches
To protect mainline code integrity, teams should enforce branch protection policies on primary repository branches (main or trunk):
- Require at least one or two peer code review approvals before merging.
- Require all baseline CI status checks (linting, compilation, unit tests, secret scanning) to pass successfully before permitting merges.
- Require branches to be rebased or updated with the target branch head to ensure verification occurred against the newest baseline.
- Strictly restrict direct push privileges to maintainers or release automation bots.
Selecting the Right Branching Strategy
Overly complex branching models (such as legacy implementations of GitFlow featuring permanent develop, release, hotfix, and long-lived feature branches) frequently result in massive “merge hell,” delayed defect discovery, and stale integration testing environments.
Trunk-Based Development:

 main/trunk  ●──────●──────●──────●──────●──────● (Continuous Fast Integration)
              \    /        \    /
  short branch \  /          \  /
                ●─●           ●─●  (Merged within 24-48 Hours)
Modern high-velocity teams favor Trunk-Based Development or Short-Lived Feature Branches:
- Trunk-Based Development: Developers push small, frequent commits directly to a shared trunk (or merge branches that live no longer than a single day). Incomplete features are protected using Feature Flags (toggles) within the code, allowing safe integration of half-finished functionality without breaking runtime execution.
- Short-Lived Feature Branches: Developers spin off a dedicated branch focused on a specific ticket or user story. The branch is merged back into the mainline branch via pull request within 24 to 48 hours. This prevents the branch from drifting significantly from the mainline codebase, keeping merge conflicts minor and manageable.
- Release Tagging: Teams tag immutable releases directly on the mainline branch using Semantic Versioning (
vMAJOR.MINOR.PATCH, e.g.,v1.4.2). This provides definitive points of reference linking deployed binaries directly to a known Git commit hash.
Build Reusable and Consistent CI/CD Pipelines
As organizations scale to dozens or hundreds of microservices and applications, maintaining independent, custom CI/CD scripts across individual repositories becomes an operational liability. Teams must treat their deployment pipelines with the exact same software engineering standards applied to production code: modularity, reusability, testability, and version control.
Shared Templates and Centralized Governance
Rather than duplicating 200 lines of pipeline configuration across every repository, platform teams should publish centralized, versioned pipeline templates and shared libraries. Modern CI/CD platforms—including GitHub Actions (Reusable Workflows), GitLab CI/CD (include templates), Jenkins (Shared Libraries), and Azure DevOps (YAML templates)—natively support modular inheritance.
+-------------------------------------------------------------+
|          Central Platform Repository: pipeline-templates    |
|   - nodejs-service-template.yml                             |
|   - go-microservice-template.yml                            |
|   - security-gate-template.yml                              |
+-------------------------------------------------------------+
                              |
        +---------------------+---------------------+
        | inherits                                  | inherits
        v                                           v
+-------------------------------+   +-------------------------------+
| App Repository: service-users  |   | App Repository: service-orders|
| Uses: nodejs-service-template |   | Uses: go-microservice-template|
+-------------------------------+   +-------------------------------+
Standardizing pipeline definitions across projects provides distinct organizational advantages:
- Uniform Security and Quality Gates: Mandating that every application runs organization-approved SAST scans, dependency audits, and container checks before build completion.
- Reduced Developer Friction: Developers onboarding a new microservice need only declare a minimal 15-line pipeline file referencing the company standard template.
- Seamless Platform Upgrades: When the platform engineering team needs to update an internal artifact storage URL, upgrade a scanner binary, or patch a base runner, modifying the central template propagates across hundreds of consumer applications instantly.
- Centralized Configuration and Versioning: Changes to core pipeline libraries are versioned (e.g.,
@v2.1.0), preventing unannounced breaking changes from disrupting downstream application workflows.
Automate Builds and Ensure Reproducibility
An automated build must be strictly reproducible: running a build pipeline against commit c3b87a2 today, next month, or three years from now must produce the identical compiled binary, container image, or packaged artifact.
Principles of Deterministic Builds
Build instability often arises when pipelines download dynamic, non-pinned dependencies or execute within drifting, stateful runner environments.
- Explicit Dependency Pinning: Never rely on unpinned package declarations or wildcards (such as
"latest",*, or loose^versions) in package manager manifests. Always commit lockfiles (package-lock.json,poetry.lock,go.sum,Cargo.lock,pom.xmlchecksums) directly to version control. This ensures that every runner downloads the exact byte-level dependency graph. - Containerized Build Environments: Execute build steps inside standardized, version-controlled container images (such as
golang:1.22-bookwormornode:20.14-alpine3.20) rather than relying on tools installed globally on bare-metal host machines. This neutralizes “works on my machine” discrepancies between local workstations and pipeline runners. - Artifact Traceability: Every build artifact must embed structural metadata connecting it to its origin: the repository URL, commit SHA, build run ID, semantic version, build timestamp, and digital signing signature.
- Optimized Build Caching: Modern builds can be slow if dependencies are fetched across the network on every commit. Implement targeted build caching for dependencies (e.g.,
.npm,.m2,go-buildcaches) and leverage multi-stage container builds with Docker layer caching to accelerate feedback loops without sacrificing environment isolation. - Fast Failure Investigation: Configure build runners to capture and export clean, structured build logs and diagnostic metadata immediately upon failure. Developers should be able to inspect stack traces and failure points in seconds without needing interactive shell access to CI workers.
Make Automated Testing a Team Responsibility
Relying on manual testing cycles as a pre-release quality gate directly breaks continuous delivery. High-performing teams embed automated testing throughout the pipeline execution lifecycle, treating quality as an ongoing engineering responsibility shared between development and QA.
       / \
      /   \        End-to-End & UI Tests (Slowest, Fewest, High Cost)
     /     \
    /-------\      Integration & API Tests (Moderate Speed, Moderate Count)
   /         \
  /-----------\    Unit Tests (Fastest, Hundreds/Thousands, Low Cost)
Structuring the Automated Test Suite
A balanced CI/CD test strategy leverages the classic Test Pyramid model:
- Unit Testing: Fast, isolated tests verifying individual functions, algorithmic routines, and business logic methods in memory using mock dependencies. These run on every branch push within 1 to 3 minutes, catching basic regressions early.
- Integration Testing: Tests validating that discrete software components interface properly with their underlying databases, distributed caches, and local network ports. These commonly run using lightweight transient test containers (such as Testcontainers).
- API and Contract Testing: Validates that service endpoints conform strictly to their published contracts (e.g., OpenAPI schemas or consumer-driven contracts using tools like Pact) to prevent breaking downstream dependent systems.
- End-to-End (E2E) and Functional Testing: Exercises the full software stack simulating actual user flows (e.g., registration, checkout, payment processing) against an integrated staging or transient preview environment. Because these tests are slower and computationally expensive, they typically run against release candidate branches or post-merge staging environments.
- Regression and Performance Testing: Automated regression suites run continuously to ensure legacy capabilities remain unimpacted. Automated load tests (using tools such as k6, Locust, or Gatling) ensure latency, memory consumption, and CPU thresholds remain within agreed Service Level Objectives (SLOs).
Handling Flaky Tests and Shared Ownership
Flaky tests—tests that randomly pass or fail without any modifications to underlying application code—erode developer trust in the pipeline. When a pipeline fails intermittently, developers start ignoring failures or rerunning pipelines repeatedly until they pass.
- Immediate Quarantine: When a test exhibits non-deterministic failure patterns, remove it from the blocking CI path immediately into a quarantined tracking suite.
- Collaborative QA & Developer Remediation: QA engineers and developers must co-investigate quarantined tests to identify the root cause—such as hardcoded sleep timers, race conditions, dirty database state, or shared test tenant collisions.
- Enforced Test Gate Realism: An example of how automated testing preserves pipeline integrity:
[Developer merges PR #402]
         |
         v
[CI Runner executes: npm run test:unit] --------> [SUCCESS: 412/412 passed]
         |
         v
[CI Runner executes: npm run test:integration] -> [FAILURE: Connection timeout to mock redis]
         |
         v
[PIPELINE ABORTED]
- Artifact packaging cancelled.
- Staging deployment blocked.
- Slack notification dispatched to Author and Reviewer: "Integration Test Failure in Auth module".
- Unstable code change isolated before reaching staging or production.
Introduce Security Early with DevSecOps
Historically, security audits occurred at the conclusion of development cycles, causing release delays when vulnerabilities were discovered just days before a planned launch. DevSecOps integrates automated security checks directly into the continuous integration workflow, shifting vulnerability identification left to the earliest point of code commit.
+--------------------------------------------------------------------------------------------------+
|                                    DevSecOps Pipeline Gates                                      |
|                                                                                                  |
| [Code Commit]                                                                                    |
|       |                                                                                          |
|       v                                                                                          |
| [Pre-Commit / Push] -------> Secret Detection (Gitleaks, Trufflehog)                             |
|       |                                                                                          |
|       v                                                                                          |
| [Static Build Phase] ------> SAST (Semgrep, SonarQube) + SCA (Trivy, Snyk)                       |
|       |                                                                                          |
|       v                                                                                          |
| [Packaging Phase] ---------> Container Scanning (Grype) + IaC Audits (Checkov, tfsec)            |
|       |                                                                                          |
|       v                                                                                          |
| [Staging Deployment] ------> DAST (OWASP ZAP) + API Dynamic Security Checks                      |
+--------------------------------------------------------------------------------------------------+
Essential DevSecOps Scanning Layers
- Secret Detection: Scan code, commit history, and configuration files using tools like Gitleaks or Trufflehog to block accidental commits of API keys, database credentials, SSH keys, or access tokens.
- Static Application Security Testing (SAST): Parse raw application source code without execution to identify common security flaws (such as SQL injections, path traversals, cross-site scripting, and insecure cryptographic primitives) using engines such as SonarQube or Semgrep.
- Software Composition Analysis (SCA): Inspect open-source third-party dependencies against national vulnerability databases (NVD) to alert developers to vulnerabilities (CVEs) in imported packages.
- Container Image Scanning: Analyze final base images and layers using tools like Trivy or Grype to identify outdated operating system packages and critical known vulnerabilities.
- Infrastructure as Code (IaC) Validation: Evaluate Terraform, CloudFormation, Ansible, and Kubernetes manifests with tools like Checkov, Kubeconform, or tfsec to detect misconfigurations (e.g., open S3 buckets, privilege escalation allowances, unencrypted storage).
- Dynamic Application Security Testing (DAST): Scan deployed running staging environments dynamically (e.g., via OWASP ZAP) by simulating external attack payloads against active endpoints.
Risk-Based Policy Enforcement
A frequent mistake when introducing DevSecOps is configuring every scanner to fail the pipeline on low-severity informational notices, overwhelming developers with noise and halting productivity.
Teams should establish pragmatic, risk-based security gates:
- Blocking Gates: Hard-fail the pipeline execution if Critical or High severity vulnerabilities with an available vendor fix are identified, or if plain-text secrets are committed.
- Non-Blocking Warnings: Log and track Medium and Low vulnerabilities as non-blocking pipeline warnings that automatically generate tracking tickets in engineering backlogs with defined remediation Service Level Agreements (e.g., remediate medium issues within 30 days).
Manage Build Artifacts and Versioning Properly
A cornerstone of enterprise CI/CD reliability is the principle of Immutable Artifact Promotion: build the application package once, store it in an artifact repository, and promote that identical binary across testing, staging, and production environments.
      INCORRECT ANTI-PATTERN: Rebuilding Across Environments
      [Source Code] ---> Build ---> Deploy Dev
      [Source Code] ---> Rebuild with Staging Flags ---> Deploy Staging (DIFFERENT BINARY!)
      [Source Code] ---> Rebuild with Prod Flags ---> Deploy Prod (UNTESTED IN STAGING!)

      CORRECT PATTERN: Immutable Artifact Promotion
      [Source Code] ---> [Single Build & Test] ---> [Push to Artifact Registry (v1.2.0)]
                                                                  |
                     +--------------------------------------------+-----------------------+
                     v                                            v                       v
             [Deploy to Test]                             [Deploy to Staging]      [Deploy to Production]
             (Inject Test Env Vars)                       (Inject Staging Vars)    (Inject Prod Vars)
Why Rebuilding Across Environments Fails
Rebuilding an application for each successive environment introduces dangerous variables:
- A dependent package may have released an upstream bug between the time staging was compiled and production was built.
- The build runner’s local compiler version or patch-level OS libraries might vary between builds.
- The artifact running in production is technically not the artifact that successfully passed integration, QA, and security validation in staging.
Centralized Artifact Repositories
Store compiled binaries, libraries, and container images in dedicated, resilient registries (such as JFrog Artifactory, Sonatype Nexus, GitHub Packages, Amazon ECR, or Google Artifact Registry).
- Semantic and Git-Linked Versioning: Never deploy container images tagged with
:latest. Tags must be explicit, immutable, and traceable, such asapp:v2.4.1-b492a1orapp:sha-7f28bc9. - Artifact Signing and Attestation: Use tools such as Cosign (Sigstore) to cryptographically sign container images and generate Software Bills of Materials (SBOM) during the CI phase. Production clusters can then enforce admission control policies, refusing to launch any container that lacks a verified signature from the organizational CI pipeline.
- Retention Policies: Implement automated lifecycle policies that retain production release artifacts indefinitely while pruning non-merged feature branch scratch builds after 14 or 30 days to optimize storage costs.
Keep Development, Testing, Staging, and Production Environments Consistent
A frequent reason deployments fail in production after passing QA is environment drift—discrepancies in OS versions, database schemas, network topology, firewall rules, or runtime configurations between environments.
Managing Consistency with Infrastructure as Code (IaC)
Environments must be declared programmatically through Infrastructure as Code (IaC) using declarative frameworks like Terraform, OpenTofu, Ansible, or Kubernetes manifests.
- Declarative Parity: Use identical IaC modules to provision local development emulators, QA clusters, staging platforms, and production infrastructure. The only differences should be parameter inputs (e.g., node count, instance sizing, disk quotas), not underlying architecture.
- Separation of Code and Configuration: Adhere strictly to the Twelve-Factor App methodology: store all application configuration parameters (database connection strings, service URLs, feature flags) outside the compiled binary as environment variables or centralized configuration maps (e.g., Consul, AWS Systems Manager Parameter Store, Kubernetes ConfigMaps).
- Enterprise Secrets Management: Secrets (encryption keys, third-party API credentials, database passwords) should never exist in repository code, pipeline YAML files, or baked container layers. Manage secrets dynamically using enterprise tools such as HashiCorp Vault, AWS Secrets Manager, or Google Secret Manager, injecting them into runtime pods via short-lived ephemeral tokens.
- Automated Cleanup of Ephemeral Environments: Enable pull request pipelines to spin up ephemeral, short-lived preview environments for automated E2E validation, and automatically destroy them once the pull request is merged or closed, preventing cost overruns and stale configuration accumulation.
Use Safe and Reliable Deployment Strategies
Automating the deployment step does not mean executing a crude script that abruptly terminates running services. Teams must implement deployment methodologies designed to minimize operational risk and eliminate downtime.
1. Rolling Update:
   Instances:  [ v1 ] [ v1 ] [ v1 ]  ===>  [ v2 ] [ v1 ] [ v1 ]  ===>  [ v2 ] [ v2 ] [ v2 ]

2. Blue-Green Deployment:
   Router/Load Balancer points to BLUE (v1)
   [BLUE Environment: v1.0 (Live)]
   [GREEN Environment: v2.0 (Idle, Verified)]  ===> Router switches all traffic to GREEN

3. Canary Release:
   Traffic Split: 95% Traffic ---> [Stable: v1.0]
                   5% Traffic ---> [Canary: v2.0] (Monitored for errors/latency)
Modern Deployment Patterns
- Rolling Deployments: The deployment platform incrementally updates instances of an application across a cluster, ensuring that a minimum threshold of healthy pods or servers remains available to process incoming user requests throughout the update.
- Blue-Green Deployments: Two identical physical or logical environments exist. One environment (Blue) runs live production traffic. The new release is deployed into the idle environment (Green), where comprehensive synthetic health checks are run. Once verified, the load balancer or ingress router switches all production traffic instantly from Blue to Green. If an unexpected failure occurs, traffic routes back to Blue immediately.
- Canary Releases: Route a tiny fraction of live user traffic (e.g., 2% to 5%) to the newly deployed software version while routing the remaining 95% to the stable baseline. Automated observability pipelines evaluate error rates, response latencies, and resource consumption. If performance degrades, traffic is automatically diverted back to the baseline; if metrics remain healthy, the canary gradually scales up to 100%.
- Feature Flags and Progressive Delivery: Decouple code deployment from feature release. Engineering teams can deploy inactive code paths to production behind a feature toggle service (e.g., LaunchDarkly, Unleash, Flagsmith). Product managers can then selectively activate the feature for internal users, beta groups, or specific geographical regions at their own pace.
- Automated Rollbacks: Pipelines must define automated rollback triggers. If post-deployment synthetic monitoring detects an elevated HTTP 5xx error rate or increased database latency within the first 10 minutes of release, the orchestrator triggers an immediate automated rollback without waiting for human escalation.
Improve Pipeline Speed and Developer Productivity
When a CI/CD pipeline takes 45 minutes to execute, developer feedback loops stall, context-switching increases, and engineers hesitate to merge small, frequent commits. Teams should target a feedback window of 5 to 15 minutes for standard build and unit test cycles.
Actionable Pipeline Optimization Techniques
- Parallel Job Execution: Deconstruct monolithic, linear pipeline stages into parallel execution graphs. Linting, unit tests, security scans, and build steps for independent modules should execute concurrently across distributed runners.
- Intelligent Dependency and Workspace Caching: Configure pipelines to cache package manager directories (
~/.npm,~/.cache,~/.m2) between runner invocations. If dependencies haven’t changed, skip downloading them entirely. - Selective and Test-Impact Analysis: For large monorepos or monolithic codebases, utilize tooling (such as Nx, Bazel, or Turborepo) that inspects Git diffs to build and test only the projects and dependencies directly impacted by the specific pull request.
- Appropriate Job Timeouts: Set strict, realistic timeouts on all pipeline jobs (e.g., cancel a test stage if it hangs for longer than 15 minutes). This prevents rogue, deadlocked processes from consuming platform runner capacity indefinitely.
- Targeted Triggering: Avoid triggering costly end-to-end integration test suites or complex multi-architecture container builds on trivial documentation or markdown updates by defining precise file-path filters in pipeline triggers.
Pipeline Optimization Matrix:

Before Optimization: 42 Minutes (Linear)
[Checkout] -> [Install (7m)] -> [Lint (3m)] -> [Build (12m)] -> [Unit (8m)] -> [SAST (12m)]

After Optimization: 9 Minutes (Parallel + Caching)
[Checkout] -> [Restore Cache (30s)]
                 |
                 +---> [Lint (1.5m)] -------------------+
                 |                                      |
                 +---> [Build & Unit Tests (7m)] -------+---> [Stage Complete (8.5m)]
                 |                                      |
                 +---> [SAST Scan (5m)] ----------------+
Strengthen Collaboration and Pipeline Ownership
A world-class CI/CD pipeline cannot succeed if it is treated as an isolated black box maintained by a lone platform engineer. Successful DevOps adoption requires a culture of shared responsibility across engineering disciplines.
Eradicating the Single-Point-of-Failure Model
When the “DevOps engineer” is the only person who understands how deployment configurations work, that individual becomes an organizational bottleneck for every release issue, build failure, and runner outage.
- Shared Pipeline Ownership: Developers must possess the tooling, access, and foundational literacy to debug their own pipeline failures. If a build breaks due to a failed compilation, a broken test, or an invalid environment variable, the author of the commit is responsible for resolving it immediately.
- QA as Test Engineers, Not Manual Checkers: QA engineers actively contribute automated test suites, maintain performance benchmarking frameworks, and review pipeline test metrics, working alongside developers to expand automated coverage.
- Platform Engineers as Enablers: Platform teams should focus on building internal developer platforms (IDP), maintaining reusable templates, optimizing runner infrastructure, and offering internal consulting to application teams, rather than manually clicking deployment buttons.
- Transparent Incident Communication: When a release failure or pipeline disruption occurs, maintain transparent communication across shared team channels (e.g., Slack or Microsoft Teams) with automated alerts, incident post-mortems, and collaborative retrospective reviews focused on systemic improvements rather than blame.
Monitor Pipeline Performance and Application Health
Achieving continuous delivery requires observability across two distinct domains: pipeline health (the efficiency of the delivery mechanism) and application health (the runtime stability of the deployed software).
+-----------------------------------------------------------------------------------------------+
|                                Comprehensive Delivery Observability                           |
|                                                                                               |
|  Pipeline Metrics (The Factory)              Application Telemetry (The Product)              |
|  - Build Success / Failure Rates              - Application Structured Logs                   |
|  - Pipeline Duration & Stage Latencies        - Prometheus Metrics (RPS, Error Rates, CPU/Mem)|
|  - Test Failure and Flakiness Trends         - OpenTelemetry Distributed Tracing             |
|  - Runner Queue Wait Times                   - Synthetic Health Checks & User SLOs           |
+-----------------------------------------------------------------------------------------------+
                                                |
                                                v
                        Unified Dashboards (Grafana) & Real-time Alerts
Metrics for the Delivery Pipeline
- Pipeline Execution Duration: Tracks the time required for a commit to traverse from validation to artifact generation. Upward trends reveal creeping dependencies or test suite bloat.
- Pipeline Success/Failure Rate: Pinpoints volatile stages (e.g., frequent failures in E2E suites versus compilation).
- Runner Queue Latency: Identifies when platform runner pools are undersized, forcing developers to wait for compute slots.
Real-Time Application Telemetry Post-Release
Deployments must connect directly to observability frameworks such as Prometheus, Grafana, and OpenTelemetry:
- The RED Method: Immediately evaluate Rate (requests per second), Errors (HTTP 5xx responses), and Duration (latency distributions: p50, p95, p99) post-deployment.
- Distributed Tracing: Monitor trace paths across interconnected microservices to ensure that a newly deployed service release does not cause cascading latency spikes in downstream components.
- Structured Logging: Ensure that applications emit machine-readable JSON logs containing request IDs, commit SHAs, and environment labels, enabling instant log aggregation and troubleshooting in centralized logging platforms.
Establish CI/CD Governance and Documentation Standards
As organizations scale across multiple business units and engineering teams, maintaining operational governance is necessary to guarantee security compliance and regulatory adherence without stifling developer velocity.
Pragmatic Pipeline Governance
- Role-Based Access Control (RBAC): Restrict sensitive pipeline capabilities (e.g., promoting code to production, overriding compliance gates, rotating cluster secrets) to authenticated, authorized identities and administrative roles.
- Immutable Audit Logging: Ensure that every pipeline execution, approval click, variable change, and deployment trigger is recorded in append-only, searchable audit logs to comply with SOC2, ISO 27001, and HIPAA frameworks.
- Formal Exception Handling: Establish an auditable protocol for emergency bypasses (such as applying a critical hotfix during an active P1 outage). An emergency release bypass must require documented approval from designated engineering leaders and trigger an immediate post-incident review.
- Internal Documentation and Runbooks: Maintain living documentation directly alongside the pipeline code. Every repository should maintain a clear
CONTRIBUTING.mdand pipeline troubleshooting guide detailing:- How to run the local equivalent of the CI test suite.
- What each pipeline stage validates.
- Who to contact when shared runners or platform services degrade.
Common CI/CD Mistakes Teams Should Avoid
| Anti-Pattern / Mistake | Operational Impact | Practical Corrective Approach |
|---|---|---|
| Maintaining Disparate Pipeline Configs | Every team reinvents the wheel; security patches and tool upgrades must be applied manually to hundreds of repos. | Adopt centralized, versioned pipeline templates and shared libraries across the organization. |
| Heavy Reliance on Manual QA | Delivery grinds to a halt; release cycles take weeks; regression testing is inconsistent and error-prone. | Invest in automated integration, API, and unit test suites; reposition QA engineers to build automated testing frameworks. |
| Tolerating Flaky Tests | Developers lose trust in pipeline failures, ignore broken builds, and rerun jobs until they pass by chance. | Quarantine unstable tests immediately; prioritize fixing root causes before re-integrating into blocking gates. |
| Hardcoding Secrets in Repositories | High risk of credential compromise, unauthorized lateral movement, and compliance failure. | Enforce pre-commit scanning with Gitleaks; inject secrets dynamically at runtime via centralized secret managers. |
| Rebuilding Binaries for Each Environment | Environmental drift; the code verified in QA is technically not the exact code deployed to production. | Build an immutable artifact once; store it in a central registry; promote the identical image across all environments. |
| Overly Permissive Pipeline Runners | Compromised CI jobs can modify cloud infrastructure, access sensitive databases, or exfiltrate production secrets. | Enforce the Principle of Least Privilege; use short-lived OIDC tokens for cloud provider authentication. |
| Skipping Post-Deploy Verification | Silent release failures, crashed pods, or broken routes remain undiscovered until end users report outages. | Implement automated smoke tests, readiness probes, and telemetry-driven deployment verification. |
| Over-Complicating Pipeline Logic | Fragile pipelines that fail due to esoteric scripting errors rather than actual code defects. | Keep pipelines declarative, modular, and focused on executing established command-line tools. |
Practical Example: Creating a Team-Based CI/CD Workflow
To illustrate how these best practices unify into an operational workflow, consider a practical implementation for a web service using GitHub Actions.
The Collaborative Workflow Lifecycle
[Developer] -> Feature Branch -> Pull Request -> Automated CI Checks (Lint, Test, SAST)
                                                        |
                                            (Peer Review Approval)
                                                        |
                                                        v
[Merge to Main] -> Standardized Pipeline Builds Container -> Pushes to Registry (Immutable Tag)
                                                        |
                                                        v
                                          Deploy to Staging (Automated)
                                                        |
                                           E2E & Smoke Validation
                                                        |
                                        Manual Production Approval Gate
                                                        |
                                                        v
                                    Canary / Rolling Deploy to Production
GitHub Actions Pipeline Implementation
The following workflow demonstrates an enterprise-style pipeline that automates testing, performs security scanning, builds an immutable container image, deploys to a staging environment, and waits for explicit approval before deploying to production.
YAML
name: Production Delivery Pipeline

on:
  push:
    branches: [ main ]
  pull_request:
    branches: [ main ]

permissions:
  contents: read
  security-events: write
  packages: write

env:
  REGISTRY: ghcr.io
  IMAGE_NAME: ${{ github.repository }}

jobs:
  # =========================================================================
  # STAGE 1: Code Quality, Automated Tests, and Security Scanning
  # =========================================================================
  validate:
    name: Test & Security Scan
    runs-on: ubuntu-latest
    steps:
      - name: Checkout Source Code
        uses: actions/checkout@v4

      - name: Setup Node.js Runtime
        uses: actions/setup-node@v4
        with:
          node-version: 20
          cache: 'npm'

      - name: Install Pinned Dependencies
        run: npm ci

      - name: Run Code Linter
        run: npm run lint

      - name: Execute Unit and Integration Tests
        run: npm test -- --coverage

      - name: Scan Code for Vulnerabilities (SAST)
        uses: securego/gosec@master
        if: always() # Continue even if previous steps logged warnings
        continue-on-error: true # Non-blocking for informational scans

      - name: Detect Secrets in Codebase
        uses: gitleaks/gitleaks-action@v2
        env:
          GITHUB_TOKEN: ${{ secrets.GITHUB_TOKEN }}

  # =========================================================================
  # STAGE 2: Build & Publish Immutable Artifact (Only on Main Branch Merge)
  # =========================================================================
  build-artifact:
    name: Build & Package Artifact
    needs: validate
    if: github.ref == 'refs/heads/main' && github.event_name == 'push'
    runs-on: ubuntu-latest
    outputs:
      image_tag: ${{ steps.meta.outputs.version }}
    steps:
      - name: Checkout Source Code
        uses: actions/checkout@v4

      - name: Set up Docker Buildx
        uses: docker/setup-buildx-action@v3

      - name: Log in to Container Registry
        uses: docker/login-action@v3
        with:
          registry: ${{ env.REGISTRY }}
          username: ${{ github.actor }}
          password: ${{ secrets.GITHUB_TOKEN }}

      - name: Extract Metadata & Compute Immutable Tags
        id: meta
        uses: docker/metadata-action@v5
        with:
          images: ${{ env.REGISTRY }}/${{ env.IMAGE_NAME }}
          tags: |
            type=sha,format=long,prefix=sha-
            type=semver,pattern={{version}}

      - name: Build and Push Docker Image
        uses: docker/build-push-action@v5
        with:
          context: .
          push: true
          tags: ${{ steps.meta.outputs.tags }}
          labels: ${{ steps.meta.outputs.labels }}
          cache-from: type=gha
          cache-to: type=gha,mode=max

  # =========================================================================
  # STAGE 3: Deploy to Staging Environment
  # =========================================================================
  deploy-staging:
    name: Deploy to Staging
    needs: build-artifact
    runs-on: ubuntu-latest
    environment:
      name: staging
      url: https://staging.example.com
    steps:
      - name: Deploy Image to Staging Cluster
        run: |
          echo "Deploying immutable image: ${{ env.REGISTRY }}/${{ env.IMAGE_NAME }}:${{ needs.build-artifact.outputs.image_tag }}"
          # Real-world command: kubectl set image deployment/webapp webapp=${{ env.REGISTRY }}/${{ env.IMAGE_NAME }}:${{ needs.build-artifact.outputs.image_tag }} -n staging

      - name: Post-Deployment Smoke & Health Validation
        run: |
          echo "Executing automated HTTP synthetic health checks against staging..."
          curl --fail --retry 5 --retry-delay 5 https://staging.example.com/healthz || exit 1

  # =========================================================================
  # STAGE 4: Deploy to Production (Gated by GitHub Environment Approvals)
  # =========================================================================
  deploy-production:
    name: Deploy to Production
    needs: [build-artifact, deploy-staging]
    runs-on: ubuntu-latest
    # Configured in GitHub repo settings with Required Reviewers (Manual Approval Gate)
    environment:
      name: production
      url: https://example.com
    steps:
      - name: Execute Canary / Rolling Deployment
        run: |
          echo "Deploying identical validated artifact to production: ${{ needs.build-artifact.outputs.image_tag }}"
          # Real-world command: helm upgrade --install webapp-prod ./charts/webapp --set image.tag=${{ needs.build-artifact.outputs.image_tag }}

      - name: Verify Production Health Metrics
        run: |
          echo "Querying Prometheus gateway for error rate spikes..."
          # Real-world command: check_metrics_slo.sh --threshold=0.01
Measuring CI/CD Success Across Teams
To evaluate whether CI/CD investments are delivering tangible operational value, engineering leaders rely on data rather than subjective sentiment.
       DORA Metrics Framework:

       Deployment Frequency          Lead Time for Changes
      +---------------------+       +---------------------+
      | How often code is   |       | Time from commit to |
      | deployed to prod    |       | running in prod     |
      +---------------------+       +---------------------+
                 |                             |
                 +--------------+--------------+
                                |
       Change Failure Rate      v    Time to Restore Service
      +---------------------+       +---------------------+
      | % of deployments    |       | Time required to fix|
      | causing prod issues |       | a production outage |
      +---------------------+       +---------------------+
The Four DORA Metrics
The DevOps Research and Assessment (DORA) framework outlines four core metrics that correlate with high-performing engineering teams:
- Deployment Frequency: How often the organization successfully releases to production. High-performing teams release multiple times per day; lower-performing teams release monthly or quarterly.
- Lead Time for Changes: The elapsed time between a developer committing code and that code running in production. Shorter lead times enable teams to ship critical fixes and features rapidly.
- Change Failure Rate (CFR): The percentage of deployments that cause a degradation of service, immediate rollback, or critical defect in production. A high CFR signals inadequate automated testing or missing validation gates.
- Time to Restore Service (MTTR): The time required to restore service availability when a production failure occurs. Automated rollbacks, blue-green routers, and telemetry directly drive this number down.
Operational Pipeline Metrics
Beyond high-level DORA metrics, teams should track operational health indicators:
- Average Pipeline Execution Time: Keeping CI under 10–15 minutes preserves developer flow state.
- Test Flakiness Percentage: Percentage of test runs that fail and subsequently pass on a retry without code adjustments.
- Vulnerability Remediation Cycle Time: The duration between when an SCA/SAST scanner detects an issue and when the patched dependency is merged into the mainline branch.
- Internal Developer Satisfaction: Engineering teams should regularly survey developers regarding pipeline reliability, runner responsiveness, and toolchain friction.
A Practical Roadmap for Improving Team CI/CD Maturity
Transitioning an organization toward CI/CD maturity requires a stepped, manageable progression rather than an overnight overhaul.
+----------------------------------------------------------------------------------------------------+
|                                CI/CD Maturity Adoption Roadmap                                     |
|                                                                                                    |
|  [Phase 1: Foundations]        Standardize Git, commit conventions, branch protection rules.       |
|            |                                                                                       |
|            v                                                                                       |
|  [Phase 2: CI & Fast Tests]    Automate deterministic builds, unit tests, and dependency locks.    |
|            |                                                                                       |
|            v                                                                                       |
|  [Phase 3: Security & Storage] Shift left with SAST/secrets; establish immutable artifact repos.   |
|            |                                                                                       |
|            v                                                                                       |
|  [Phase 4: Env Parity & CD]    Standardize staging with IaC; implement automated CD deployments.   |
|            |                                                                                       |
|            v                                                                                       |
|  [Phase 5: Advanced Delivery]  Canary/blue-green rollouts, DORA metrics, automated rollbacks.      |
+----------------------------------------------------------------------------------------------------+
10 Steps to Pipeline Maturity
- Assess Existing Delivery Workflows: Map the current journey of a code change from local workstation to production. Identify all manual sign-offs, handoffs, wait times, and recurring failure modes.
- Standardize Source Control Practices: Migrate long-lived branches toward trunk-based development or short-lived feature branches with strict branch protection rules and peer reviews.
- Automate Core Builds and Unit Testing: Ensure that every push automatically executes pinned dependency installations, static linters, and fast unit tests.
- Publish Reusable Pipeline Templates: Centralize pipeline YAML definitions into a version-controlled repository to eliminate duplication across microservices.
- Integrate Security Scanners (DevSecOps): Introduce pre-commit secret detection, dependency scanning (SCA), and non-blocking SAST gates early in the process.
- Standardize Immutable Artifact Management: Build binaries and container images once, tag them with traceable Git SHAs, and publish them to a secure central registry.
- Establish Environment Parity with IaC: Declare development, QA, staging, and production environments using declarative IaC (Terraform, Kubernetes) to eliminate configuration drift.
- Automate Deployment and Verification: Transition from manual deployment scripts to automated rolling or blue-green deployments with post-deployment synthetic smoke tests.
- Implement Observability and DORA Tracking: Connect deployment events directly to Prometheus, Grafana, and APM platforms; track deployment frequency and change failure rates.
- Iterate Continuously: Hold blameless post-mortems for release disruptions, review test suite runtimes monthly, and continuously optimize pipeline caching and parallelization.
Frequently Asked Questions (FAQ)
What are the most important CI/CD best practices for teams?
The fundamental best practices are: standardizing on short-lived branches; running fast, automated test suites on every commit; building immutable artifacts once and promoting them across environments; shifting security scans left into the pipeline; and maintaining environment consistency through Infrastructure as Code.
How can multiple developers work with the same CI/CD pipeline?
Developers work on short-lived branches (or trunk-based commits) and submit pull requests. The CI pipeline triggers independently for each branch, testing isolated changes before they merge. Using branch protection rules and dynamic ephemeral preview environments allows multiple engineers to integrate code simultaneously without colliding or breaking the mainline branch.
Should every project use a standardized pipeline?
Yes. Using standardized, versioned pipeline templates across an organization ensures consistent security scanning, quality gates, and compliance monitoring. However, templates should provide parameter inputs and extension hooks so specific projects can configure custom build arguments, testing flags, and runtime constraints without altering core standards.
How can teams improve CI/CD pipeline performance?
Teams can accelerate execution by executing independent testing and scanning stages in parallel, caching package manager dependencies across runner invocations, employing multi-stage Docker builds with layer caching, setting strict timeouts on hanging tasks, and testing only the modules impacted by a change using workspace tooling.
What role does QA play in CI/CD?
In modern CI/CD, QA transitions from manual gatekeepers to quality engineers. They collaborate with developers to design automated end-to-end (E2E), integration, performance, and API test suites, manage dynamic test data, establish failure thresholds, and triage flaky tests to ensure tests run reliably within the automated pipeline.
How can teams integrate security into CI/CD?
Teams integrate security by shifting left: scanning code for plain-text secrets at commit time, auditing third-party open-source libraries for known vulnerabilities (SCA), parsing application source code for insecure patterns (SAST), and scanning container base images before pushing them to registries. High-risk flaws should block builds, while lower-severity items generate backlog tasks.
Which CI/CD tools are suitable for development teams?
Modern development teams widely adopt GitHub Actions, GitLab CI/CD, and Azure DevOps for their deep native integration with source code repositories, flexible containerized runners, and robust template ecosystems. Jenkins remains a viable choice for organizations requiring extensive self-hosted customization and legacy integration, though it demands more operational maintenance.
How can teams reduce deployment failures?
Teams reduce failures by maintaining environmental parity between staging and production via Infrastructure as Code, deploying identical, pre-tested immutable artifacts, validating deployments with automated synthetic smoke checks, and leveraging progressive rollout strategies like canary releases and blue-green deployments with automated rollback triggers.
What are the most useful metrics for measuring CI/CD success?
The four DORA metrics (Deployment Frequency, Lead Time for Changes, Change Failure Rate, and Time to Restore Service) provide the industry standard for delivery performance. Teams also monitor operational pipeline duration, automated test pass rates, test flakiness percentages, and runner queue latency.
Driving Continuous Improvement Through CI/CD
Building a resilient CI/CD delivery pipeline is fundamentally an ongoing discipline of continuous learning, architectural refinement, and organizational alignment. While modern automation platforms provide powerful tools, the ultimate success of an engineering organization depends on team culture: shared ownership of build quality, disciplined testing practices, early security integration, and transparent post-incident analysis.
By starting with a simple, reliable pipeline, keeping builds fast, standardizing on immutable artifacts, and gradually automating deployment verification, cross-functional teams can replace manual handoffs with predictable, stress-free releases. Whether an engineering organization is standardizing its first automated integration workflow or refining complex multi-region canary deployments, organizations and learning platforms such as DevOpsSchool reinforce that technical discipline and cross-team collaboration remain the true drivers of sustainable software velocity. Pick one area of your delivery lifecycle—whether addressing a flaky test suite, caching dependencies, or adding automated secret scanning—and begin iterating toward a faster, safer deployment process today.