








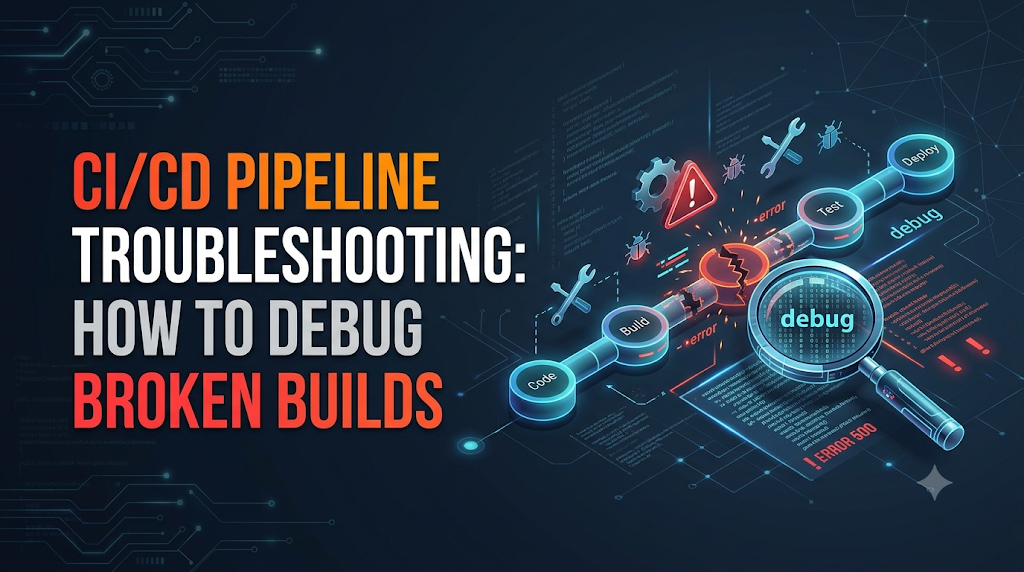
A developer pushes a feature branch, watches the build and test suites pass cleanly, and is suddenly stopped by a failed deployment stage. When delivery workflows break without an obvious cause, hitting the retry button or committing speculative fixes only burns compute time and obscures the underlying problem. Modern engineering teams rely on learning platforms like DevOpsSchool to build real-world automation skills, and that includes mastering a forensic, evidence-based approach to pipeline failures. Instead of guessing, effective pipeline debugging begins with the symptoms: determining precisely what command failed, when the issue began, whether it is reproducible, and what changed across the runtime environment, dependencies, or infrastructure.
Building a Diagnostic Picture Before Making Changes
Making blind edits to pipeline configuration files is the fastest way to compound an error. Before altering any configuration or pushing experimental commits, you must build a comprehensive diagnostic picture from the artifacts and metadata left behind by the failed run.
+-------------------------------------------------------------------------------+
|                           EVIDENCE GATHERING PHASE                            |
+-------------------------------------------------------------------------------+
|  1. Timeline & Dependencies  --> Check stage runtimes, job graphs, exit codes  |
|  2. Execution Context        --> Audit commit SHA, runner architecture, OS    |
|  3. Log Forensic Analysis    --> Separate root errors from downstream noise   |
|  4. State Comparison         --> Diff current run against last green build    |
+-------------------------------------------------------------------------------+
1. Inspect the Pipeline Execution Timeline and Dependency Graph
Modern continuous delivery workflows execute jobs both sequentially and concurrently based on directed acyclic graph (DAG) rules. Begin by determining where the failure sits in this execution chain.
A failure in a downstream packaging job may not stem from the packaging script itself; it may result from an upstream compile job that exited cleanly while producing a malformed or zero-byte binary. Reviewing the overall execution timeline helps identify whether a job failed instantly (indicating a setup, syntax, or permission issue) or timed out after running for an extended duration (indicating deadlocks, resource exhaustion, or unresponsive network endpoints).
2. Capture the Exact Exit Codes and Executed Commands
Automated pipelines rely on POSIX process exit codes to determine whether a step succeeded or failed. An exit code of 0 signals success, while any value from 1 to 255 denotes an error.
Certain exit codes carry explicit operational meaning:
1: General runtime errors, unhandled exceptions, or application crashes.2: Misuse of shell built-ins or invalid command syntax.126: Command found but not executable (often a file permission problem, such as a missing execution bitchmod +x).127: Command not found (indicating a missing dependency, binary, or misconfigured system$PATH).137: Fatal error signal 9 (SIGKILL), almost always triggered by an Out-Of-Memory (OOM) killer on the runner or host OS.143: Fatal error signal 15 (SIGTERM), typically indicating a job-level timeout imposed by the CI/CD orchestration engine.
Identifying the precise exit code prevents confusing resource limits with code bugs.
3. Separate the Primary Root Cause From Cascading Failures
When an automated task crashes, it often dumps hundreds of lines of secondary stack traces, teardown logs, and cleanup notifications.
A common pitfall is scrolling directly to the final ten lines of the console log. In most pipeline engines, the bottom of the log merely shows post-job cleanup routines, failed health probes, or notification script errors.
Always scroll upward to find the first point of deviation—the exact line where a command printed to standard error (stderr) or returned a non-zero exit code. Everything that follows is often background noise caused by the initial failure.
4. Diff Against the Last Successful Run
When an issue appears ambiguous, run a side-by-side comparison between the failed execution and the most recent successful run on the same branch or the main branch.
Audit the following differences:
- Commit SHA: What exact code changes were introduced?
- Runner Environment: Did the runner OS patch level, container tag, or architecture change (for example, an implicit shift from
amd64toarm64)? - Runtimes and Packages: Did an unpinned tool or dynamic package install pull down a new minor or patch release?
- Environment Variables: Were any pipeline variables, secrets, or branch protection parameters updated between the runs?
Decision-Based Troubleshooting Workflows
Pipeline failures fall into distinct operational categories. Rather than guessing, apply a structured troubleshooting path tailored to the specific failure symptom.
                     +---------------------------------------+
                     | Pipeline Reports an Execution Failure |
                     +---------------------------------------+
                                         |
     +-------------------+---------------+-------------------+-------------------+
     |                   |                                   |                   |
[Build Phase]       [Test Phase]                     [Execution Timing]     [Deploy Phase]
     |                   |                                   |                   |
Check checkout,     Inspect test reports,             Check runner queues,  Audit credentials,
compilers, tool     environment parity,               resource starvation,  network routes,
versions, runners   flaky tests, timeouts             and lock contention   and target infra
Path A: Build Fails Before Tests Start
When a build step fails prior to test suite execution, the issue involves the source tree checkout, compiler/runtime tools, or external package resolution.
- Typical Symptoms:
npm installthrows network errors;go buildreports syntax or version mismatches; Docker builds fail during aCOPYinstruction; compilation scripts fail immediately with missing header files. - Diagnostic Questions:
- Did the checkout step retrieve all necessary submodules and tags?
- Are toolchain versions explicitly pinned, or did an unpinned runtime drift?
- Can the build runner reach internal or external artifact registries?
- Evidence to Collect: The complete shell environment printout (
envorprintenv), the compiler error logs, lockfile diffs (package-lock.json,Cargo.lock,poetry.lock), and runner memory utilization. - Corrective Actions:
- Pin compiler and language runtime versions strictly (e.g., use
node:20.11.1instead ofnode:latest). - Verify authentication tokens for private package registries.
- Ensure the runner disk space is not exhausted by stale build caches or orphaned Docker layers.
- Pin compiler and language runtime versions strictly (e.g., use
Path B: Tests Fail While Application Builds Successfully
The code compiles and packages clean binaries, but automated validation suites exit with red flags.
- Typical Symptoms: Unit tests fail with null pointer exceptions; integration tests fail to connect to mock databases; tests pass individually but fail when executed in parallel.
- Diagnostic Questions:
- Does the test harness rely on static file paths or system time zones that differ on the CI agent?
- Are integration test dependencies (e.g., PostgreSQL, Redis, local messaging queues) fully initialized before the test suite begins execution?
- Are tests sharing mutable state across concurrent execution threads?
- Evidence to Collect: Individual test framework JUnit/XML reports, database container logs, runner CPU and memory saturation metrics, and system clock configurations.
- Corrective Actions:
- Implement active readiness checks (e.g., polling database ports using
pg_isreadyor custom socket checks) rather than relying on arbitrary sleep commands likesleep 10. - Isolate test state by generating unique database schemas or container instances per test thread.
- Quarantine identified flaky tests into a non-blocking suite while analyzing their timing dependencies.
- Implement active readiness checks (e.g., polling database ports using
Path C: The Pipeline Hangs or Runs Unusually Slowly
The job does not explicitly fail, but it runs for hours or hits the maximum execution timeout limit.
- Typical Symptoms: Jobs remain queued indefinitely; console output halts after initiating an external call; build duration spikes from 5 minutes to 45 minutes without corresponding code expansion.
- Diagnostic Questions:
- Is an interactive CLI prompt waiting for user input (
[y/N]) inside a non-interactive shell? - Is the build agent competing for limited IOPS, network bandwidth, or CPU cores with other noisy-neighbor workloads?
- Are multiple concurrent workflows attempting to acquire an exclusive lock on an external environment or database?
- Is an interactive CLI prompt waiting for user input (
- Evidence to Collect: Runner agent queue lengths, process table snapshots (
ps aux --forest), active network sockets (netstat -tunaporss -tulpn), and CPU wait states. - Corrective Actions:
- Ensure all package managers and tools are invoked with non-interactive flags (e.g.,
apt-get install -y,npm ci,terraform apply -auto-approve). - Enforce aggressive, explicit timeouts at the individual step and job levels rather than relying solely on global engine timeouts.
- Scale self-hosted runner fleets or migrate to ephemeral, single-use container instances to eliminate resource contention.
- Ensure all package managers and tools are invoked with non-interactive flags (e.g.,
Path D: Artifacts Are Missing, Incomplete, or Corrupted
Downstream jobs fail because an expected archive, compiled binary, container image, or package cannot be found.
- Typical Symptoms: Downstream stages fail with
No such file or directory; artifact download steps report empty zip archives; container registries returnmanifest unknown. - Diagnostic Questions:
- Is the artifact path defined as a relative path that depends on the current working directory?
- Did an earlier step produce the artifact outside the expected runner workspace?
- Have artifact retention policies or size limits been exceeded?
- Evidence to Collect: Step working directories, shell glob expansion logs, artifact upload metadata, and permissions on generated target files.
- Corrective Actions:
- Standardize paths using built-in CI environment variables (e.g.,
$GITHUB_WORKSPACE,$CI_PROJECT_DIR). - Run a verification step (e.g.,
ls -lah ./dist/) immediately before uploading artifacts to fail early if an expected binary is missing. - Check file access masks (
umask) to guarantee that artifacts generated by a root-level container step can be read by downstream, unprivileged steps.
- Standardize paths using built-in CI environment variables (e.g.,
Path E: Deployment Fails After a Successful Build
The application passes all compilation and testing stages, but the operational deployment step fails to apply changes to target environments.
- Typical Symptoms: Authentication failures against cloud providers; timeout during Kubernetes rolling updates; health check endpoints returning HTTP 500 or 502; firewall rejections.
- Diagnostic Questions:
- Have service account tokens, deployment keys, or OpenID Connect (OIDC) trust relationships expired or been revoked?
- Does the deployment runner have network access through security groups, firewalls, or VPC peering connections to the target cluster?
- Did the newly deployed container crash on startup due to missing runtime configuration?
- Evidence to Collect: Target infrastructure logs (e.g.,
kubectl describe pod, cloud service events), deployment role assume-policy outputs, and ingress/egress firewall logs. - Corrective Actions:
- Transition from static, long-lived credentials to short-lived identity federation via OIDC.
- Inspect deployment health probe configurations to ensure readiness deadlines allow sufficient application startup time.
- Verify that target deployment namespaces and cloud accounts match the targeted environment branch (staging vs. production).
Path F: Intermittent or Random Failures
The pipeline fails unpredictably. Retrying the run without changes succeeds in some instances and fails in others.
- Typical Symptoms: Failures occur primarily during peak business hours; tests fail occasionally due to network timeouts; random build steps fail to download public packages.
- Diagnostic Questions:
- Is the build querying public upstream dependencies that impose rate limits (e.g., Docker Hub anonymous pull limits)?
- Are concurrent jobs attempting to write to shared file systems or modify shared cloud infrastructure resources?
- Are race conditions present in parallel integration tests?
- Evidence to Collect: Upstream HTTP status codes (specifically
429 Too Many Requests), concurrency graphs, and cache hit/miss statistics. - Corrective Actions:
- Route package downloads through local caching proxies or internal pull-through mirrors.
- Decouple concurrent jobs so they operate in entirely isolated ephemeral environments.
- Authenticate against public image registries to increase rate-limit thresholds.
Debugging the Execution Environment
The phrase “It works on my machine” remains one of the most common justifications for broken builds. In reality, a local workstation and a CI runner are fundamentally different execution environments.
+-----------------------------------------------------------------------------------+
|                        LOCAL MACHINE VS. CI RUNNER RUNTIME                        |
+-----------------------------------------------------------------------------------+
| Attribute          | Developer Workstation            | CI/CD Runner Agent        |
+--------------------+----------------------------------+---------------------------+
| OS & Kernel        | macOS / Windows / Linux Desktop  | Minimal Linux (Alpine/Deb)|
| Shell Environment  | Interactive (zsh, bash) + RC init| Non-interactive, POSIX sh |
| Toolchains         | Broad set of system libraries    | Hermetic, minimal packages|
| File System        | Case-insensitive (macOS/Win)     | Case-sensitive (ext4/xfs) |
| System User        | Sudoer / Desktop admin           | Unprivileged/Strict UID   |
| State & Cache      | Retained local caches & configs  | Ephemeral or isolated dir |
+--------------------+----------------------------------+---------------------------+
Environmental Differences That Break Pipelines
- Case Sensitivity: Developing on macOS or Windows often hides file naming discrepancies because the underlying filesystems default to case-insensitivity. Pushing code that imports
./services/AuthServicewhen the file is named./services/authservice.tswill succeed locally but crash on an ext4-based Linux runner. - Hidden Local Dependencies: A developer workstation frequently has globally installed utilities, system-level shared libraries (
libc,openssl), or manually placed configuration files in$HOME/.config. In contrast, a clean CI runner contains only what is explicitly provisioned by its runner image or pipeline definition. - Interactive vs. Non-Interactive Shells: Local terminals run interactive login shells, sourcing
.bashrc,.zshrc, or.profile. Continuous delivery runners execute non-interactive subshells, which do not load personal shell profiles, resulting in missing$PATHupdates or alias definitions. - Permissions and User IDs: Developers often build applications using their local workstation user account. CI runners often execute within containers using unprivileged users or locked-down UIDs that cannot write outside designated workspace paths.
Real-World Reproduction: The Missing System Dependency
Consider a Python application that uses psycopg2 to interface with PostgreSQL. On a local machine, the developer runs:
Bash
pip install -r requirements.txt
python manage.py test
The tests pass locally. However, when pushed to a clean CI runner using a standard python:3.11-slim container, the pipeline fails during dependency installation:
Collecting psycopg2==2.9.9
  Downloading psycopg2-2.9.9.tar.gz (384 kB)
  Preparing metadata (setup.py) ... error
  error: subprocess-exited-with-error

  Error: pg_config executable not found.

  pg_config is required to build psycopg2 from source. Please add the directory
  containing pg_config to the PATH or specify the full path with the
  --pg-config option.
The developer’s workstation already had the PostgreSQL client libraries installed globally from prior database experiments. The minimal CI container did not.
Verifying and Fixing the Discrepancy
To resolve this, avoid modifying production source code. Update the pipeline definition to provision the required native system packages explicitly before executing the language package manager:
YAML
# Fix: Ensure system-level build tools and C-libraries are present
- name: Install System Dependencies
  run: |
    apt-get update && apt-get install -y --no-install-recommends \
      gcc \
      libpq-dev \
      build-essential
    rm -rf /var/lib/apt/lists/*

- name: Install Application Dependencies
  run: |
    python -m pip install --upgrade pip
    pip install -r requirements.txt
Alternatively, switch the dependency to use pre-compiled binary wheels (psycopg2-binary) to avoid compiling native C extensions entirely.
Advanced Troubleshooting Techniques
When standard log analysis fails to surface the root cause, engineers must apply deeper diagnostic techniques to isolate the issue.
1. Controlled Diagnostic Verbosity
Most build and deployment tools suppress internal trace details by default to keep logs readable. When diagnosing persistent failures, enable high verbosity selectively on the failing step. Avoid enabling global debug flags across the entire workflow, as this generates megabytes of irrelevant log statements that obscure key errors.
- Shell Scripts: Use
set -xto print each command and its arguments to standard output as it executes. Useset -eto exit immediately if any command returns a non-zero exit status, preventing an error from cascading into later steps:Bash#!/usr/bin/env bash set -euo pipefail # Commands will now print before execution, and unbound variables trigger failure - Package Managers: Pass
--verbosetonpm,yarn, orpipto expose detailed HTTP handshakes and system calls. - Infrastructure as Code: Run
terraformwithTF_LOG=DEBUGoransible-playbookwith-vvvvto inspect API request and response payloads.
Security Warning: Highly verbose logs often print runtime headers, query parameters, or decrypted configurations. Ensure that log masking rules are active so credentials and tokens are not written to console output.
2. Hermetic Local Reproduction
Attempting to debug an issue by continuously pushing empty commits to a remote repository is slow and clutters git history. Instead, replicate the runner’s exact environment locally.
If the pipeline runs inside a Docker container, pull the exact container image digest used by the runner, mount your local codebase into the container, strip your local environment variables, and run the commands manually:
Bash
# Pull the exact container image used by the CI runner
docker pull node:20.11.1-bookworm-slim

# Launch an interactive shell with an isolated, clean workspace
docker run --rm -it \
  --network bridge \
  -v "$(pwd)":/workspace \
  -w /workspace \
  --entrypoint /bin/bash \
  node:20.11.1-bookworm-slim

# Inside the container: Execute commands sequentially in non-root mode
npm ci
npm run build
This approach allows you to evaluate environmental variables, file permissions, and system paths in real time.
3. Environment Snapshot Auditing
When an environment-dependent error occurs, insert a temporary diagnostic step immediately prior to the failing command. Capture system state to standard output:
Bash
echo "=== SYSTEM DIAGNOSTIC SNAPSHOT ==="
uname -a
whoami
id
pwd
df -h
free -m
env | sort | grep -v -E 'SECRET|TOKEN|KEY|PASSWORD|AUTH'
which node npm python docker 2>&1 || true
Reviewing this snapshot often highlights missing utilities, unexpected user mappings, or disk partitions running low on available inodes.
4. Running Minimal Reproductions
If a multi-step pipeline fails cryptographically or during a large test run, isolate the failure by constructing a minimal pipeline file or a standalone test branch.
Strip away non-essential jobs—such as security scans, code style linters, and notifications. Focus exclusively on the single failing command. If the failure disappears in the minimal pipeline, progressively reintroduce stages until the conflict re-emerges, identifying the hidden interaction.
Platform-Specific Debugging
While the fundamental principles of diagnosis remain universal, each major continuous delivery platform features its own configuration models, execution semantics, and diagnostic capabilities.
1. Jenkins
+-------------------------------------------------------------------------------+
| Jenkins Master                                                                |
|   |--> Schedules Pipeline                                                     |
|   |--> Injects Credentials Store                                              |
|                                                                               |
|   Distributed Agent (Node)                                                    |
|     |--> Workspace: /var/jenkins_home/workspace/job_name                      |
|     |--> Process execution: Shell / Docker / Kubernetes Pod                   |
+-------------------------------------------------------------------------------+
Jenkins pipelines run on distributed master-agent architectures via declarative or scripted Groovy DSL scripts.
- Console Output and Full Stage Logs: The classical Jenkins UI can truncate logs or fail to associate terminal output with specific stages. Always navigate to the Pipeline Console view or use the Classic UI console text view (
/consoleText) to read raw, non-truncated logs. - Workspace Contamination: Unlike modern ephemeral platforms, traditional Jenkins static agents reuse persistent workspaces on physical or virtual hosts. An earlier build might leave behind untracked artifacts, stale lockfiles, or owned root files.
- Diagnostic check: Add a workspace wipe step using the
cleanWS()step plugin inside apostblock or pre-execution block:Groovypipeline { agent { label 'linux-builder' } stages { stage('Clean Workspace') { steps { cleanWs() checkout scm } } } }
- Diagnostic check: Add a workspace wipe step using the
- Agent Capability Mismatches: If a build remains queued with the message
"Waiting for next available agent matching label 'docker-node'", inspect the master node management dashboard under Manage Jenkins > Nodes. Verify whether the target agent is offline, disconnected due to an untrusted SSH key exchange, or lacking disk space.
2. GitHub Actions
GitHub Actions structures automation around workflows, jobs, and individual steps using self-hosted or cloud-hosted runners.
- Enabling Runner Diagnostic Logging: GitHub Actions provides built-in debug logging flags. You can enable them without altering code by navigating to repository secrets and adding:
ACTIONS_RUNNER_DEBUG: set totrue(outputs runner execution logs, environment registration, and step setup).ACTIONS_STEP_DEBUG: set totrue(outputs internal step executions, credential sanitization details, and variable resolution).
- Missing or Restricted Permissions: A frequent cause of failures in GitHub Actions is the default
$GITHUB_TOKENpermissions. Under repository settings, default permissions can be set to read-only.- Diagnostic check: If a step fails while creating a release, pushing a package, or writing a PR comment, inspect the workflow-level permissions block:YAML
permissions: contents: read packages: write pull-requests: write
- Diagnostic check: If a step fails while creating a release, pushing a package, or writing a PR comment, inspect the workflow-level permissions block:YAML
- Cache Corruption: When using
actions/cache, bad dependencies or broken build states can be cached, causing every subsequent build to fail.- Corrective action: Invalidate the cache by changing the cache key version in your workflow YAML (e.g., changing a cache key prefix from
v1-build-tov2-build-), or delete the problematic cache through the repository’s Actions > Caches management interface.
- Corrective action: Invalidate the cache by changing the cache key version in your workflow YAML (e.g., changing a cache key prefix from
3. GitLab CI/CD
GitLab CI/CD utilizes a centralized coordinator that delegates jobs to modular, multi-tenant, or dedicated agents known as GitLab Runners via .gitlab-ci.yml.
- Investigating Job Traces and Exit Codes: GitLab provides an execution trace directly in the web UI. If a job fails without an obvious error, look for warning banners at the top of the trace, such as
"Job failed: execution took longer than 1h0m0s"or"Runner failed to pull image". - Runner Executor Issues: GitLab Runners support various executors (
docker,kubernetes,shell,virtualbox). A job configured to run Docker commands will fail under a standarddockerexecutor unless Docker-in-Docker (dind) or a socket-binding configuration is explicitly configured:YAML# Diagnosing Docker build issues inside GitLab CI build_image: image: docker:24.0.5 services: - docker:24.0.5-dind variables: DOCKER_TLS_CERTDIR: "/certs" script: - docker info # Verifies successful connection to the background dind daemon - docker build -t my-app . - YAML Linting and Rules Evaluation: Complex
rules:blocks can result in jobs running unexpectedly or being excluded entirely. Use the built-in CI Lint tool in the GitLab UI to validate your.gitlab-ci.ymlsyntax and evaluate how rules match against different branch contexts.
4. Azure DevOps Pipelines
Azure Pipelines supports builds and releases through YAML-defined pipelines and classic visual workflows.
- System Diagnostics Mode: To force full tracing on an Azure DevOps run, queue the build manually and check the box labeled Enable system diagnostics, or define the variable
system.debugastruein the pipeline definition. - Service Connection Failures: Deployments to cloud providers like Azure or AWS rely on service connections. When an Azure task fails with an authorization error, navigate to Project Settings > Service Connections. Check if the service principal credentials have expired or if the service connection requires an explicit administrative grant for the specific pipeline branch.
- Agent Demand Mismatches: If a job remains indefinitely queued on a self-hosted agent pool, inspect the
demandssection. If a job specifies a demand likenpmordocker, the pool coordinator will hold the job in queue until an agent explicitly registers that capability tag.
Hands-On Exercise: Diagnosing a Broken Pipeline
To turn these diagnostic concepts into practice, walk through this troubleshooting lab. We will use a lightweight Node.js web application configured with a CI/CD workflow that contains a deliberate runtime bug.
Lab Objective
Diagnose a broken build step, trace the error using console outputs, fix the underlying environment configuration, and verify that the pipeline runs cleanly to completion.
Prerequisites
- A basic terminal shell (bash or zsh)
- Docker installed locally (or access to a GitHub repository with Actions enabled)
Step 1: The Broken Pipeline Setup
Below is a broken GitHub Actions workflow (.github/workflows/ci.yml) intended to build a Node.js application and package its distribution files:
YAML
name: Application Delivery Pipeline

on: [push, pull_request]

jobs:
  build-and-package:
    runs-on: ubuntu-latest
    steps:
      - name: Checkout Codebase
        uses: actions/checkout@v4

      - name: Set up Node.js
        uses: actions/setup-node@v4
        with:
          node-version: '18'

      - name: Install Dependencies
        run: |
          npm ci

      - name: Build Assets
        run: |
          export NODE_ENV=production
          ./scripts/build.sh

      - name: Verify Distribution Directory
        run: |
          ls -lah dist/bundle.js
The referenced build script (scripts/build.sh) contains:
Bash
#!/usr/bin/env bash
mkdir -p dist
echo "Compiling client bundles..."
# Simulate a build step that reads an environment configuration
if [ -z "${API_ENDPOINT}" ]; then
  echo "FATAL: API_ENDPOINT environment variable is not defined!" >&2
  exit 1
fi

echo "/* Bundle Content */" > dist/bundle.js
echo "Build complete."
Step 2: Observe the Pipeline Failure
When this workflow runs, the pipeline crashes at the Build Assets step. The console displays the following trace:
Run ./scripts/build.sh
  ./scripts/build.sh
  shell: /usr/bin/bash -e {0}
  env:
    NODE_ENV: production
Compiling client bundles...
FATAL: API_ENDPOINT environment variable is not defined!
Error: Process completed with exit code 1.
The next step, Verify Distribution Directory, is marked with a grey cancellation icon and never executes.
Step 3: Forensic Analysis and Root Cause Identification
- Analyze the Exit Code: The step failed with
exit code 1, which means an internal command exited with an intentional operational failure rather than a timeout (143) or memory crash (137). - Find the Deviation Point: The line
Compiling client bundles...prints to standard output, immediately followed by an explicit error message on standard error:FATAL: API_ENDPOINT environment variable is not defined!. - Trace the Dependency: The script
./scripts/build.shexpects the variableAPI_ENDPOINTto be populated at runtime. In the pipeline definition, onlyNODE_ENV=productionwas exported inline, leavingAPI_ENDPOINTundefined.
Step 4: Apply the Corrective Action
Update the pipeline definition to provide the required environment variable.
YAML
      - name: Build Assets
        env:
          NODE_ENV: production
          API_ENDPOINT: "https://api.internal.example.com"
        run: |
          chmod +x ./scripts/build.sh
          ./scripts/build.sh
(Note: Adding chmod +x is a defensive practice ensuring the shell script maintains execution permissions across different checkout environments).
Step 5: Verification
Push the updated workflow file. The pipeline now executes the build script cleanly:
Run ./scripts/build.sh
  Compiling client bundles...
  Build complete.
The subsequent step executes as expected:
Run ls -lah dist/bundle.js
  -rw-r--r-- 1 runner docker 21 Nov 10 10:15 dist/bundle.js
The pipeline returns to a healthy green state.
Challenge 2: The Intermittent Missing Artifact
Now consider a second scenario: downstream test jobs occasionally fail with the error:
cat: dist/bundle.js: No such file or directory
Diagnostic Walkthrough
- The Investigation: You observe that Job A (
build) and Job B (test) run on separate, independent virtual runners. The developer assumed that files written todist/on Job A would automatically exist on the filesystem for Job B. - Root Cause: CI/CD runners are isolated virtual machines or containers. Files do not persist across distinct jobs unless explicitly uploaded to the central coordinator as build artifacts.
- The Correction: Use the workflow engine’s native artifact transfer mechanism:YAML
# Inside Job A (Build): - name: Upload Build Artifacts uses: actions/upload-artifact@v4 with: name: client-dist path: dist/ # Inside Job B (Test/Deploy): - name: Download Build Artifacts uses: actions/download-artifact@v4 with: name: client-dist path: dist/
Production Note: For quick local testing, saving artifacts inside a local runner directory is acceptable. For enterprise production systems, always use explicit artifact upload actions or publish versioned packages directly to an artifact repository (such as Nexus, Artifactory, or cloud storage buckets) with managed retention policies.
Why the Same Failures Keep Returning
When engineering teams spend significant time fixing the same pipeline errors week after week, the issue is rarely technical incompetence. It usually points to systematic architectural shortcomings in the delivery pipeline.
+-------------------------------------------------------------------------------+
|                       THE VICIOUS CYCLE OF FLAKY BUILDS                       |
+-------------------------------------------------------------------------------+
|                                                                               |
|   +-------------------+       +-------------------+       +---------------+   |
|   | Unstable Tooling/ | ----> | Pipeline Breaks   | ----> | Team Hits     |   |
|   | Dynamic Upstreams |       | Intermittently    |       | "Re-Run"      |   |
|   +-------------------+       +-------------------+       +---------------+   |
|             ^                                                     |           |
|             |                                                     v           |
|             |          +--------------------+             +---------------+   |
|             +--------- | Root Cause Ignored | <---------- | Build Passes  |   |
|                        | Technical Debt Grew|             | on Retry      |   |
|                        +--------------------+             +---------------+   |
+-------------------------------------------------------------------------------+
1. Unpinned and Floating Dependencies
Using dynamic dependency ranges (e.g., "package": "^2.1.0" or Docker tags like node:latest) invites unverified changes into your pipeline. A build that passes on Friday can fail on Monday simply because an upstream maintainer published a buggy minor patch over the weekend.
- Remedy: Pin every dependency. Use strict lockfiles (
package-lock.json,Gemfile.lock), lock container base images by their immutable SHA256 digest (e.g.,golang@sha256:45b...), and require peer review for any dependency upgrade.
2. Inconsistent Runner Infrastructure
Teams using self-hosted runners often let individual machines develop configuration drift. One runner may have specific OS packages installed, while another runner in the same pool lacks them. Workflows fail or succeed purely based on which agent picks up the job.
- Remedy: Treat runners as disposable infrastructure. Build runner images using automation tools like Packer, or use ephemeral container runners that are destroyed immediately after executing a single job.
3. Poor Test Isolation and Shared State
Tests that read from or write to external persistent stores without resetting state inevitably experience cross-test pollution. When test suites run in parallel, one test may delete a user record that another concurrent test is actively validating.
- Remedy: Design tests to generate their own isolated fixtures and unique identifiers (e.g., UUID-based usernames). When external services like databases are required, use lightweight ephemeral test containers (such as the Testcontainers framework) that spin up and tear down per test runner.
4. Flawed Cache Invalidation
Caches are designed to speed up execution, but when cache keys are defined too broadly, stale artifacts survive across builds.
- Remedy: Cache keys should always incorporate a cryptographic hash of the respective dependency lockfile (for example:
cache-key-${{ hashFiles('**/package-lock.json') }}). If the dependencies do not change, the cache is hit; if a package is added or updated, a new cache is generated automatically.
5. Lack of Clear Pipeline Ownership
When continuous delivery pipelines sit in an organizational no-man’s-land between product developers and infrastructure engineers, neither group takes ownership of pipeline health. Build failures are treated as nuisances rather than blockers.
- Remedy: Establish an operational service level objective (SLO) for pipeline reliability. Treat a broken main pipeline with the same urgency as a production bug, and assign an engineer to investigate root causes whenever a build fails.
Improving Pipeline Observability and Failure Reporting
Debugging is easier when the system provides meaningful, structured diagnostics by default. Transforming a pipeline from an opaque black box into an observable system requires clear logging and reporting practices.
+-------------------------------------------------------------------------------+
|                       PIPELINE OBSERVABILITY STACK                            |
+-------------------------------------------------------------------------------+
| Metrics:   Job runtimes, queue latency, failure frequencies, retry counts     |
| Tracing:   Step-by-step execution duration, dependency graph bottlenecks      |
| Logging:   Structured JSON output, isolated error streams, sanitized traces   |
| Alerts:    Actionable messages sent to team channels with direct log links    |
+-------------------------------------------------------------------------------+
1. Structure Logs for Human and Machine Parsing
Avoid dumping unformatted text into the console. Group related commands into logical, collapsable sections using your platform’s native formatting features:
- GitHub Actions:Bash
echo "::group::Run Database Migrations" ./bin/migrate-database echo "::endgroup::" - GitLab CI:Bash
echo -e "\e[0Ksection_start:`date +%s`:db_migration[collapsed=true]\r\e[0KDatabase Migration" ./bin/migrate-database echo -e "\e[0Ksection_end:`date +%s`:db_migration\r\e[0K"
2. Export Structured Test and Coverage Reports
Do not force engineers to parse thousands of lines of shell logs to locate a single unit test failure. Configure test runners to emit standard JUnit-compatible XML reports. CI platforms can parse these reports and present a dedicated UI tab listing the exact failed test cases, execution durations, and associated stack traces.
3. Monitor Agent Fleet Metrics
Track your continuous delivery infrastructure with the same rigor applied to production workloads:
- Queue Time: How long does a job wait for an available runner? Increasing wait times indicate agent shortages or undersized autoscaling policies.
- Job Duration Trends: Are build durations slowly creeping upward? Monitoring timing trends allows you to address build bloat before jobs hit hard timeouts.
- Failure Frequency by Step: Identifying which steps fail most often helps platform teams prioritize engineering investments (e.g., refactoring flaky test suites or replacing unstable package repositories).
4. Provide Context-Rich, Safe Notifications
A chat alert that simply says "Pipeline #452 failed" forces an engineer to log into the dashboard and search through raw text.
Improve your team notifications (Slack, Microsoft Teams, or email) to include:
- Repository name and target branch
- Commit author and commit message
- The exact job and stage that failed
- Direct link to the raw failure log
- Total execution time before failure
+-----------------------------------------------------------------------+
| Pipeline Failure Alert                                                |
| Repository: core-api | Branch: main | Triggered by: @alex             |
| Commit: 8e4b1c2 - "Update transaction processing logic"               |
|                                                                       |
| Failed Stage: Integration Tests (Duration: 4m 12s)                   |
| Error summary: DatabaseMigrationTimeoutException on line 142          |
|                                                                       |
| [View Console Logs] | [Compare Commits] | [View Test Report]          |
+-----------------------------------------------------------------------+
Ensure sensitive values are masked before sending alerts. Review CI masking patterns to confirm that authorization tokens, database connection strings, and certificates are redacted from notification payloads and build outputs.
A Practical Framework for Handling Production Pipeline Incidents
When a pipeline failure halts production deployments, treat the failure with the same structured discipline as a production application outage. Follow this incident response workflow:
[Phase 1: Assess] --------> Determine release impact and identify blocked teams
       |
[Phase 2: Preserve] ------> Archive logs, artifacts, and commit metadata
       |
[Phase 3: Classify] ------> Isolate to Code, Configuration, or Infrastructure
       |
[Phase 4: Mitigate] ------> Apply smallest safe fix or roll back blocking commits
       |
[Phase 5: Verify] --------> Validate fix in clean branch; restore pipeline operations
       |
[Phase 6: Prevent] -------> Complete root-cause analysis and update documentation
1. Assess Impact
Determine what is blocked. Can normal developer builds continue, or is this failure blocking all engineering pull requests? Is an urgent production patch waiting behind this pipeline?
- If a production fix is blocked, prioritize unblocking the deployment path before attempting a deep architectural fix.
2. Identify the Scope
Determine if the failure affects one branch, a single repository, or the entire organization.
- If a single repository is broken, the issue is likely code- or workflow-related.
- If all team pipelines fail simultaneously, focus on shared infrastructure: runner networks, cloud identity providers, or third-party service outages.
3. Preserve the Evidence
Before retrying or triggering new jobs, preserve the failed run’s artifacts. Some systems delete ephemeral run logs on rerun. Copy the complete console log, screenshot the dependency graph, and save the failed commit SHA.
4. Classify the Failure Domain
Isolate the failure into one of three domains:
- Application Code: Compilation error, failing unit/integration tests, bad logic.
- Configuration: Malformed YAML, missing environment variable, expired token.
- Infrastructure: Runner out of disk space, network blip, container registry rate-limiting.
5. Apply the Smallest Safe Correction
Avoid introducing broad refactors while trying to resolve a blocking pipeline failure. If a recent commit broke the pipeline, the safest mitigation is often a git revert of that commit. Reverting returns the delivery pipeline to a known-stable state, allowing engineers to debug the underlying issue offline on a separate branch.
6. Validate in an Isolated Branch
Never push experimental fixes directly to the main or production branch. Push the proposed fix to a dedicated troubleshooting branch, confirm that the entire workflow passes from end to end, and only then merge it into the primary branch.
7. Document the Root Cause
Once the pipeline is green, schedule a brief review. Document:
- What happened?
- Why did it happen?
- What was the immediate fix?
- What architectural improvement (e.g., pinning dependencies, expanding runner storage, updating health probes) will prevent this failure from recurring?
Debugging Checklist for Daily Operations
Keep this checklist handy for day-to-day CI/CD troubleshooting.
Before Investigating
- Confirm whether the failure is reproducible or intermittent.
- Check if other pipelines in the organization are experiencing identical issues.
- Verify if third-party providers (GitHub, GitLab, Docker Hub, AWS) have active incidents.
- Check whether the pipeline succeeded on an earlier run with the exact same commit.
During Log Analysis
- Scroll past post-job teardown steps to find the first error message printed to
stderr. - Identify the exact process exit code (
1,127,137,143). - Verify which user account and directory the command executed in.
- Check whether the failure occurred during setup, execution, or artifact archiving.
While Reproducing the Failure
- Run the failing command inside an identical, isolated container image locally.
- Verify that all required environment variables and secrets are defined.
- Check for differences in case-sensitivity, file paths, or line endings (
CRLFvs.LF). - Test the pipeline step with a clean, unpopulated cache.
Before Applying a Fix
- Verify that the change addresses the root cause rather than hiding the symptom.
- Ensure that credentials, private tokens, and secrets remain masked and protected.
- Confirm that toolchains and package versions are pinned to immutable tags or digests.
- Test the fix on a feature branch before merging to production-critical branches.
After the Pipeline Recovers
- Verify that all downstream stages (packaging, deployment, verification) complete cleanly.
- Clean up any diagnostic log flags or temporary snapshot commands introduced during debugging.
- Document the incident and root cause in your team’s engineering knowledge base.
Frequently Asked Questions
1. What is the best way to start debugging a failed CI/CD pipeline?
Start by reading the console log from the top down to locate the first point of failure. Avoid scrolling straight to the end of the log, where teardown routines often display misleading secondary errors. Note the failing stage, the exact shell command that returned the error, and its exit code. Next, compare the failed run with the most recent passing run to identify what changed in the code, runner, dependencies, or environment configuration.
2. How can I find the root cause of a pipeline error?
Isolate variables systematically. Check whether the issue is tied to code changes, pipeline configuration, or runner infrastructure. Increase log verbosity selectively on the failing step using flags like set -x or --verbose. Replicate the environment locally using the runner’s exact container image. If the issue is complex, create a minimal pipeline branch that runs only the failing command to eliminate noise from other stages.
3. Why does my pipeline fail when the code works locally?
Workstations differ significantly from automated runners. Common reasons include:
- Case-insensitive filesystems on macOS/Windows masking case-sensitive import bugs on Linux runners.
- Undeclared system libraries or tools installed globally on the local machine but missing from minimal CI runners.
- Differences between interactive login shells and non-interactive CI shells.
- Hardcoded local paths, uncommitted files, or missing environment variables.
4. How do I troubleshoot a Jenkins build failure?
First, examine the raw, untruncated console output by appending /consoleText to the build URL. Check if the build failed on the controller or an agent. For workspace corruption, add a cleanWs() step to wipe stale files. If a job remains stuck in the queue, inspect Manage Jenkins > Nodes to verify that agents matching the required labels are online, connected, and have adequate free disk space.
5. How can I debug a failed GitHub Actions workflow?
Enable debug logging by creating two repository secrets: ACTIONS_RUNNER_DEBUG and ACTIONS_STEP_DEBUG, both set to true. This outputs detailed information about step execution, runner initialization, and environment variable resolution. Review the workflow’s permissions block to ensure the $GITHUB_TOKEN has appropriate read/write scopes. If dependencies seem broken, invalidate the cache by updating the key in actions/cache.
6. What causes intermittent pipeline failures?
Intermittent failures typically stem from:
- Race conditions in parallelized test suites sharing mutable databases or state.
- Network timeouts or rate-limiting (e.g., HTTP 429 errors from public package managers or registries).
- Tests that depend on time zones, system clocks, or execution order.
- Flaky integration tests that use arbitrary
sleepcalls instead of active health checks. - Unpinned dependencies pulling down new upstream versions unpredictably.
7. How can I investigate a pipeline that gets stuck?
A stuck pipeline usually means a command is waiting for user interaction in a non-interactive shell (such as an unconfirmed package prompt). It can also indicate a deadlocked process, an unhandled database lock, or an external network request without an explicit timeout. Inspect the process tree on the runner, ensure all commands use non-interactive flags (e.g., -y), and configure explicit timeouts on individual steps.
8. Why are deployment jobs failing after successful builds?
A successful build only confirms that code compiles and passes tests. Deployment failures usually stem from operational mismatches:
- Expired cloud credentials, invalid IAM roles, or misconfigured OIDC trust policies.
- Network boundaries, such as runners lacking access through firewalls, security groups, or private VPCs.
- Target environment issues, such as Kubernetes clusters lacking compute capacity to schedule new pods.
- Application health checks failing because runtime configurations or secrets are missing in the target environment.
9. Should I retry a failed pipeline or investigate it first?
Always investigate first. Retrying a failed job without checking the logs treats the symptom and reinforces the acceptance of flaky builds. If a run fails, spend two minutes reviewing the log. If the failure was clearly caused by an external infrastructure outage that has since recovered, a retry is reasonable. If the cause is unknown, retrying merely hides flaky tests or concurrency bugs that will inevitably return.
10. How can teams prevent recurring CI/CD failures?
Prevent recurring failures by building consistency into your delivery architecture:
- Pin all language runtimes, compilers, and dependencies using explicit lockfiles.
- Use immutable container image digests rather than floating tags like
:latest. - Use ephemeral runners to eliminate configuration drift between builds.
- Isolate test suites using independent mock services or isolated test containers.
- Establish team ownership of pipeline reliability and prioritize fixing broken builds immediately.
Make Every Failure Easier to Diagnose
A broken continuous delivery pipeline is an operational stress test of your engineering workflow, not just an inconvenient roadblock. The goal of continuous integration troubleshooting is never merely turning a single red dashboard green, but making the entire pipeline more observable, deterministic, and resilient against future failures. By replacing guesswork with disciplined log analysis, isolated runtime testing, and immutable dependency pinning, teams transform fragile deployment scripts into dependable release systems. Documenting every failure and treating delivery infrastructure with the same engineering rigor as production code ensures that when an error does occur, your team can diagnose and fix it with confidence.