









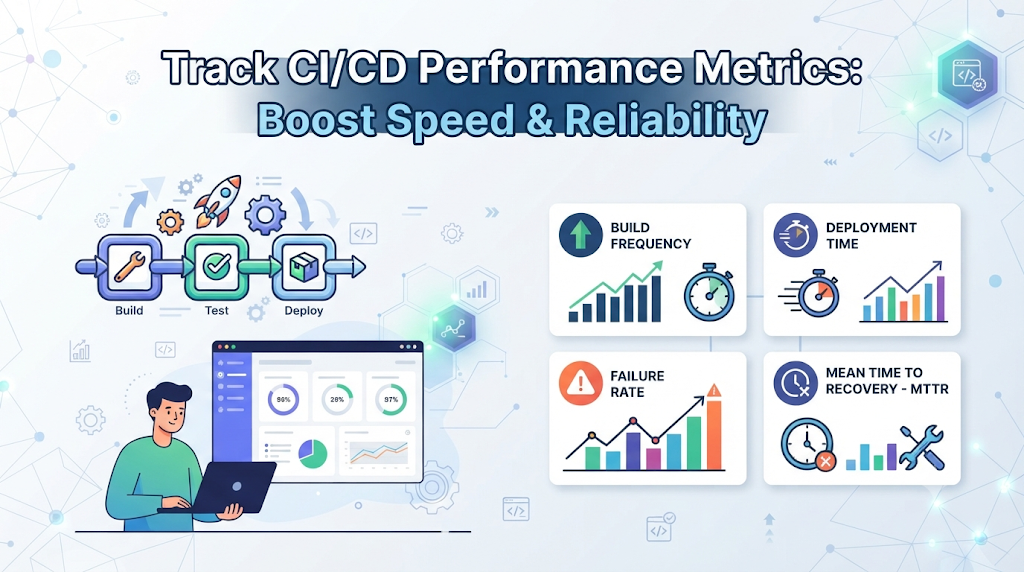
When development teams notice that software releases are dragging and builds frequently fail without warning, identifying the root cause of the slowdown becomes an engineering bottleneck in itself. Without reliable pipeline data, teams rely on guesswork rather than facts, leaving them unable to fix inefficient workflows. By systematically tracking CI/CD performance metrics across every stage of the delivery pipeline, engineering organizations can eliminate friction, uncover hidden bottlenecks, and make data-driven improvements that accelerate software delivery safely.
1. What CI/CD Performance Metrics Actually Measure
CI/CD performance metrics are quantitative measurements that capture the speed, reliability, and efficiency of your software delivery pipeline. They matter because they provide an objective view of how code travels from a developer’s workstation into production environments.
What Metrics Reveal
- Speed of software delivery: How rapidly changes move through build, test, and release stages.
- Reliability of pipeline execution: Whether builds and tests complete successfully on the first attempt or require repeated interventions.
- Build and test efficiency: How well compilation, packaging, and automated test suites perform.
- Deployment performance: How consistently changes reach target environments without manual blockers.
- Frequency of delivery failures: How often builds or releases break due to code, configuration, or environment issues.
- Recovery from unsuccessful releases: How quickly teams restore normal operations when things fail.
- Infrastructure and runner utilization: How efficiently computing resources are consumed during pipeline execution.
Performance Metrics vs. Software Delivery Metrics vs. Business Outcome Metrics
It is important to distinguish between different layers of measurement. Pipeline performance metrics focus on technical execution within the CI/CD system—such as build duration, test execution time, and runner utilization. Software delivery metrics, such as DORA metrics, look at broader outcomes like deployment frequency and lead time for changes. Business outcome metrics measure value delivered to users, such as revenue impact or user retention.
Measuring activity alone—such as counting the number of commits made per day—does not necessarily reveal whether software delivery is improving. A team can generate high activity while remaining trapped in a slow, fragile delivery pipeline.
2. Build a Measurement Map of the CI/CD Pipeline
Before choosing individual metrics, you need to understand where data originates. Instead of treating the pipeline as a black box, divide it into discrete, measurable stages. A comprehensive pipeline measurement map covers:
- Source checkout and validation: Fetching source code from version control and validating repository states.
- Dependency installation: Downloading libraries, packages, and external modules required for compilation.
- Build and compilation: Converting source code into executable binaries or deployable packages.
- Automated testing: Executing unit, integration, and functional test suites.
- Security and quality checks: Running static code analysis, vulnerability scanners, and license compliance checks.
- Artifact creation and storage: Packaging build outputs and pushing them to an artifact repository.
- Deployment: Distributing artifacts to staging, pre-production, or production environments.
- Post-deployment verification: Executing smoke tests, health checks, and monitoring confirmation.
Illustrative Pipeline Timeline
[Checkout: 15s] -> [Dependencies: 45s] -> [Build: 120s] -> [Tests: 300s] -> [Security: 90s] -> [Artifacts: 30s] -> [Deploy: 60s]
Tracking timing, reliability, and resource consumption at each stage helps teams isolate where delays and failures originate.
3. The Essential Metrics Every CI/CD Team Should Track
To build a robust monitoring practice, focus on a core set of metrics that capture both execution speed and delivery reliability. Professionals exploring advanced software delivery practices and CI/CD automation often look to structured learning programs like DevOpsSchool to deepen their expertise in operational metrics.
Pipeline Execution Time
- What it measures: The total time required for a complete pipeline run, from initiation to final completion.
- Calculation method: End timestamp minus start timestamp for a pipeline instance.
- Why it matters: Long execution times delay feedback to developers and slow down release cadences.
- Unexpected change indication: A sudden spike often points to network delays during dependency downloads, new heavy test suites, or resource contention on runner nodes.
- Improvement actions: Implement caching, parallelize independent jobs, and upgrade runner hardware.
Build Duration
- What it measures: The time taken to compile source code or package the application.
- Calculation method: Finish time minus start time of the build job stage.
- Why it matters: Directly impacts how quickly developers know if their code compiles cleanly.
- Unexpected change indication: Increased build times usually indicate unoptimized dependency management or growing codebase size without incremental compilation strategies.
- Improvement actions: Optimize compiler flags, cache intermediate build objects, and split monolithic build jobs.
Test Execution Time
- What it measures: The time required to complete automated test suites.
- Calculation method: Finish time minus start time of the test stage.
- Why it matters: Comprehensive testing is vital, but slow tests create massive bottlenecks.
- Unexpected change indication: Growing test durations stem from adding synchronous integration tests without parallelization.
- Improvement actions: Split test suites across parallel runners, isolate unit tests from slow integration checks, and run heavy end-to-end tests asynchronously.
Pipeline Success Rate and Failure Rate
- What it measures: The percentage of pipeline executions that complete successfully versus those that fail.
- Calculation method:$$\text{Success Rate} = \left(\frac{\text{Successful Pipelines}}{\text{Total Pipeline Runs}}\right) \times 100$$$$\text{Failure Rate} = \left(\frac{\text{Failed Pipelines}}{\text{Total Pipeline Runs}}\right) \times 100$$
- Why it matters: Indicates overall pipeline stability and code quality entering the pipeline.
- Unexpected change indication: A rising failure rate reveals unstable test environments, faulty commits, or broken infrastructure dependencies.
- Improvement actions: Address flaky tests, enforce strict pre-commit checks, and stabilize environment dependencies.
Deployment Frequency
- What it measures: How often an organization successfully deploys changes to a selected environment (such as staging or production).
- Calculation method: Count of successful deployments over a given time period (e.g., deployments per day or week).
- Why it matters: Reflects the organization’s agility and capacity to deliver value continuously.
- Unexpected change indication: A drop in deployment frequency suggests growing manual review overhead or pipeline friction.
- Improvement actions: Automate approval gates, reduce batch sizes, and increase test confidence.
Lead Time for Changes
- What it measures: The time elapsed from a code change being committed to its successful deployment in production.
- Calculation method: Production deployment timestamp minus initial commit timestamp.
- Why it matters: Measures the end-to-end speed of the delivery value stream.
- Unexpected change indication: Increasing lead times indicate queuing delays, slow reviews, or manual deployment steps.
- Improvement actions: Streamline pull request reviews, automate testing stages, and adopt continuous deployment.
Change Failure Rate
- What it measures: The proportion of production deployments that result in a failure requiring immediate intervention, rollback, or hotfix.
- Calculation method:$$\text{Change Failure Rate} = \left(\frac{\text{Failed Deployments}}{\text{Total Deployments}}\right) \times 100$$
- Why it matters: Ensures speed does not come at the cost of stability and quality.
- Unexpected change indication: High failure rates point to inadequate automated testing or insufficient pre-production validation.
- Improvement actions: Enhance automated regression testing and introduce canary deployments.
Mean Time to Restore (MTTR)
- What it measures: The average time required to restore service after a production incident occurs.
- Calculation method: Total cumulative downtime divided by the number of incidents over a period.
- Why it matters: Measures operational resilience and recovery capability.
- Unexpected change indication: Prolonged recovery times suggest complex rollback procedures or poor observability.
- Improvement actions: Automate rollback mechanisms and improve monitoring alerts.
4. Go Beyond Speed: Measure Pipeline Reliability
A fast pipeline that frequently fails or produces unpredictable results is worse than a slightly slower, dependable one. Reliability ensures that engineering teams trust their automation.
Key Reliability Dimensions
- Flaky test frequency: Tests that pass or fail intermittently without code changes.
- Repeated pipeline retries: How often developers manually rerun failed jobs hoping for a different outcome.
- Build reproducibility: Ensuring identical inputs consistently produce identical outputs.
- Artifact availability: Verifying that built packages are reliably stored and retrievable.
- Runner availability: Ensuring execution nodes have sufficient capacity without queuing delays.
- Infrastructure-related failures: Build failures caused by network timeouts, disk space exhaustion, or cloud provider outages rather than application code.
Distinguishing Failures
Teams must separate genuine application defects (failing unit tests due to logic errors) from infrastructure failures (network timeouts fetching external packages). Lumping these together distorts root-cause analysis.
Example: The Hidden Cost of Retries
If a pipeline has an automated retry policy that masks transient network flakes on test runners, the nominal success rate might look high (98%). However, if 30% of those runs required two or three internal retries to succeed, the actual reliability is poor, and developers waste hours waiting while background retries quietly consume runner capacity.
5. Find Bottlenecks Through Stage-Level Analysis
To optimize pipeline execution time, you must pinpoint exactly which stages consume the most time. Common bottlenecks include:
- Slow dependency downloads from external registries.
- Inefficient build processes lacking incremental compilation.
- Bloated test suites running sequentially.
- Security scans that block the pipeline unnecessarily early.
- Artifact upload and download delays over slow network links.
- Runner capacity limits causing long queue times.
Hypothetical Stage Duration Breakdown
Consider a pipeline taking 12 minutes (720 seconds) in total:
- Source checkout: 15 seconds
- Dependency installation: 180 seconds
- Build compilation: 120 seconds
- Unit and integration tests: 310 seconds
- Security scanning: 65 seconds
- Deployment: 30 seconds
Here, dependency installation and test execution consume over 68% of the total time. Focusing optimization efforts on checkout or deployment would yield negligible results, whereas caching dependencies and parallelizing tests will dramatically improve overall speed. Always diagnose the root cause of a delay before implementing caching, parallel execution, or scaling infrastructure.
6. Measure Developer Waiting Time and Delivery Friction
Pipeline metrics directly impact the daily experience and productivity of developers. Friction in the pipeline manifests as:
- Time spent waiting for build feedback on pull requests.
- Queue waiting times when runner capacity is saturated.
- Repeated failed runs caused by environment inconsistencies.
- Manual approval delays that stall otherwise complete pipelines.
- Time required to diagnose and debug obscure pipeline failures.
Measuring these friction points helps organizations remove administrative and technical roadblocks. Importantly, pipeline metrics should be used to improve systems, workflows, and tools—never to rank individual developers or create toxic performance quotas.
7. Collect CI/CD Performance Data From Pipeline Tools
Modern CI/CD platforms provide rich telemetry data that teams can harvest.
- Jenkins: Offers build histories, stage views, and plugins that export metrics to monitoring systems.
- GitHub Actions: Provides workflow run logs, execution timestamps, and REST APIs for workflow analytics.
- GitLab CI/CD: Includes built-in analytics dashboards tracking deployment frequency, lead time, and job durations.
- Azure DevOps Pipelines: Offers pipeline analytics, test trend reports, and failure rate tracking.
Core Data Points to Extract
- Pipeline run identifiers and unique hashes.
- Job start and completion timestamps.
- Stage duration breakdowns.
- Job status (success, failure, canceled, skipped).
- Retry counts and timeout events.
- Deployment audit records.
- Runner CPU, memory, and queue utilization.
Teams can gather consistent data using platform APIs, built-in reports, and pipeline event webhooks.
8. Build a CI/CD Performance Dashboard
A well-structured monitoring dashboard brings clarity to engineering leadership and development teams alike. Organize your dashboard into clear operational sections:
Delivery Speed Section
- Average pipeline duration trend.
- Build and test duration breakdowns.
- Deployment frequency over time.
- Lead time for changes distribution.
Pipeline Reliability Section
- Overall success and failure rates.
- Retry frequency and flaky test trends.
- Deployment success rate.
Resource Utilization Section
- Runner CPU and memory usage graphs.
- Queue waiting time trends.
- Concurrent job utilization metrics.
Recovery and Quality Section
- Change failure rate tracking.
- Mean time to restore (MTTR) trends.
- Failed deployment history.
Use time ranges, environment filters, and service filters to drill down into specific microservices or teams without cluttering the view.
9. Understand the DORA Metrics and Their Relationship With CI/CD
The four traditional DORA metrics measure elite software delivery performance:
- Deployment Frequency: How often code is successfully released.
- Lead Time for Changes: How long it takes code to reach production.
- Change Failure Rate: The percentage of deployments causing failures.
- Time to Restore Service: How quickly service is recovered after an outage.
Relationship With CI/CD
DORA metrics assess broader software delivery outcomes across the organization, while pipeline-specific metrics (like build duration, test execution time, and runner utilization) help teams understand the technical processes contributing to those outcomes. Improving pipeline performance directly drives better DORA outcomes, but DORA metrics alone do not tell you which pipeline stage is failing. Treat them as complementary layers of insight.
10. A Practical Exercise: Analyze a Slow CI/CD Pipeline
To put these concepts into practice, let’s analyze a hypothetical application pipeline using illustrative sample data.
Sample Pipeline Stage Durations
- Source checkout: 20 seconds
- Dependency installation: 210 seconds (downloads full vendor packages on every run)
- Build: 150 seconds
- Unit tests (sequential): 400 seconds
- Security scanning: 90 seconds
- Artifact publishing: 30 seconds
- Deployment: 50 seconds
- Total Execution Time: 950 seconds (~15.8 minutes)
Analysis Questions
- The longest pipeline stage: Unit tests (400 seconds) followed closely by dependency installation (210 seconds).
- The biggest source of waiting time: Running all unit tests sequentially without parallelization.
- Repeated failures or retries: Logs show dependency installation fails 15% of the time due to external network timeouts.
- Opportunities for safe parallel execution: Splitting the unit test suite across 4 parallel runner shards.
- Measurements to monitor after optimization: Dependency cache hit rate, test execution duration, and overall pipeline execution time.
Sample Performance Report Summary
- Findings: Dependency downloads and sequential unit tests account for over 64% of total pipeline run time. Network timeouts during dependency fetching inflate failure rates.
- Proposed Changes: Implement artifact caching for dependencies and split unit tests into 4 parallel jobs.
- Validation Criteria: Reduce total pipeline execution time from 15.8 minutes to under 7 minutes while maintaining a success rate above 95%.
11. Turn Performance Measurements Into Improvements
Once metrics highlight your bottlenecks, prioritize optimizations that deliver high impact with manageable effort:
- Dependency caching: Store downloaded packages locally to eliminate repeated download delays.
- Build optimization: Compile only modified code modules using incremental builds.
- Test parallelization: Distribute test suites across multiple concurrent execution nodes.
- Better test selection: Run fast unit tests on every commit and reserve heavy integration tests for nightly builds.
- Reusable pipeline components: Standardize CI/CD templates across teams to eliminate redundant configurations.
- Faster runner provisioning: Utilize auto-scaling cloud runners to eliminate queue waiting times.
- Improved artifact management: Optimize storage locations and clean up old artifacts regularly.
- Reduced unnecessary triggers: Prevent pipelines from running on documentation-only commits or unrelated file changes.
Always measure metrics before and after implementing an optimization to verify its actual impact rather than relying on assumptions.
12. Common Mistakes When Tracking CI/CD Metrics
Avoid these frequent pitfalls when building your measurement strategy:
- Tracking too many metrics without clear operational objectives.
- Focusing exclusively on pipeline execution time while ignoring reliability.
- Ignoring queue waiting time when calculating delivery speed.
- Treating every failed pipeline run as an application code defect without checking infrastructure health.
- Hiding underlying reliability issues through automatic retries.
- Comparing teams operating in vastly different technology stacks or delivery contexts.
- Relying solely on averages without examining performance distributions and outliers.
- Setting arbitrary performance targets that encourage gaming the metrics.
- Using individual developer metrics as personal productivity scores.
- Failing to review metrics regularly in engineering syncs.
13. Create a Continuous CI/CD Performance Improvement Routine
Transform metrics tracking into a sustainable habit by following a structured improvement cycle:
[1. Establish Baseline] -> [2. Identify Bottleneck] -> [3. Select Improvement] -> [4. Implement Change] -> [5. Compare Results] -> [6. Review & Repeat]
- Step 1 – Establish a Baseline: Collect pipeline measurements over a representative two-week period.
- Step 2 – Identify the Main Bottleneck: Analyze stage-level durations, queue times, and failure logs.
- Step 3 – Select One Improvement: Choose a specific, high-impact issue with a measurable expected outcome.
- Step 4 – Implement the Change: Apply the optimization cleanly in a controlled manner.
- Step 5 – Compare Results: Measure the exact same metrics before and after implementation.
- Step 6 – Review and Repeat: Document findings in team retrospectives and select the next improvement opportunity.
Frequently Asked Questions
1. What are CI/CD performance metrics?
CI/CD performance metrics are quantitative measurements that evaluate the speed, reliability, efficiency, and resource utilization of software delivery pipelines.
2. Which CI/CD metrics should teams track first?
Teams should start by tracking pipeline execution time, build duration, test execution time, pipeline success rate, and deployment frequency before expanding into advanced reliability and DORA metrics.
3. How do you calculate pipeline success rate?
Divide the number of successful pipeline executions by the total number of pipeline runs over a specific period, then multiply by 100 to get a percentage.
4. What is the difference between build duration and pipeline execution time?
Build duration measures only the time required to compile code or package binaries, whereas pipeline execution time measures the entire end-to-end duration from code commit to final deployment verification.
5. How do DORA metrics relate to CI/CD performance?
DORA metrics evaluate broad software delivery outcomes (like deployment frequency and lead time), while CI/CD metrics measure the technical pipeline processes that drive those outcomes.
6. How can teams identify slow pipeline stages?
By instrumenting pipeline tools to capture start and completion timestamps for each individual stage (checkout, dependency install, build, test, deploy) and analyzing duration distributions.
7. Why should queue waiting time be measured?
Queue waiting time reveals whether runner capacity is saturated, helping teams distinguish actual build slowness from infrastructure resource constraints.
8. How can flaky tests affect pipeline performance?
Flaky tests cause unnecessary pipeline failures, forcing manual retries, wasting compute resources, and eroding developer trust in automated feedback.
9. Which dashboards are useful for CI/CD monitoring?
Dashboards that group metrics into logical categories: delivery speed, pipeline reliability, resource utilization, and recovery performance.
10. How often should teams review CI/CD performance metrics?
Teams should review metrics during regular sprint retrospectives or monthly engineering reviews to catch emerging bottlenecks early.
Conclusion: Measure the Pipeline to Improve the Delivery System
CI/CD performance improvement starts with reliable measurement and clear interpretation. By combining speed, reliability, developer waiting time, resource utilization, and delivery outcome metrics, engineering teams gain a holistic view of their delivery capability instead of blindly optimizing a single number. The ultimate goal of tracking CI/CD performance is not to create more dashboards, but to discover where delivery gets delayed, understand why it happens, and make continuous improvements that can be verified through data.